Breadfast Analytics Dashboard
تفاصيل العمل
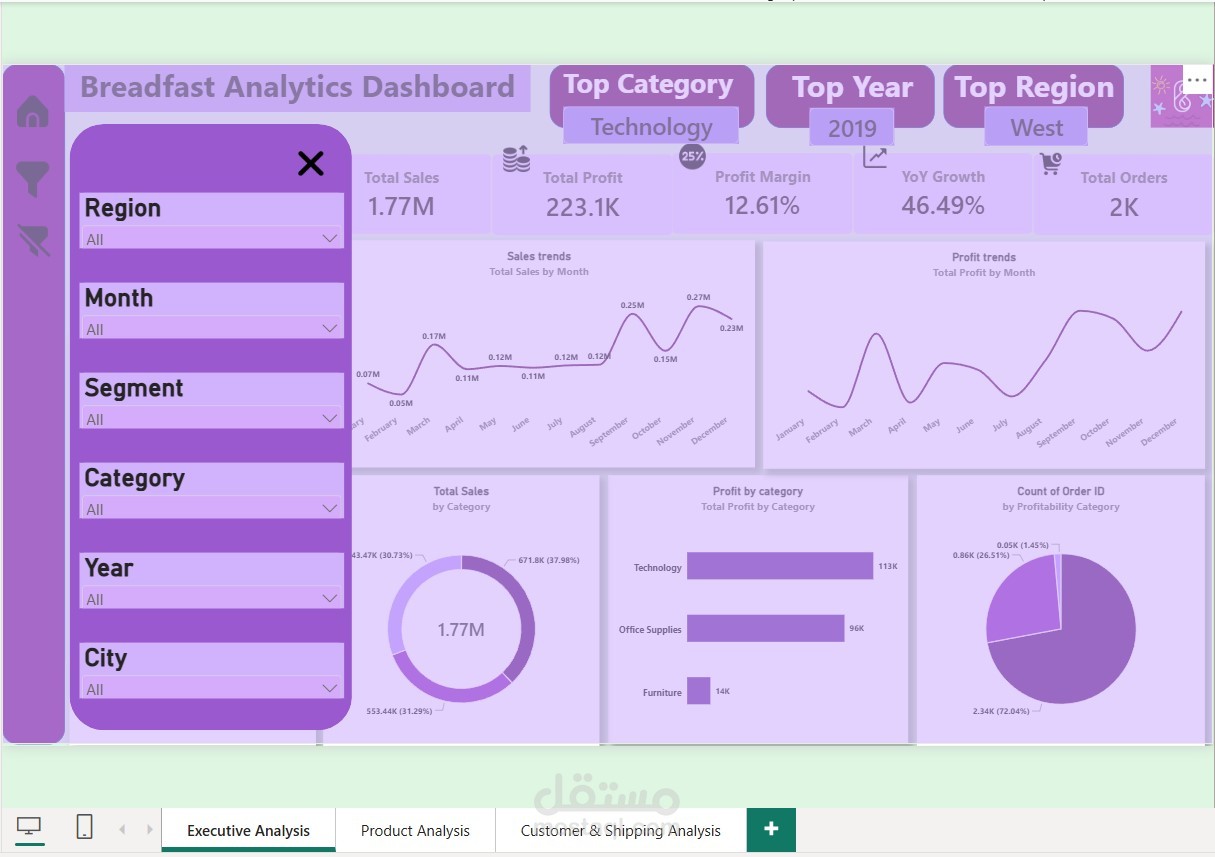
Breadfast Analytics Dashboard
Power BI | Data Analysis | Data Visualization
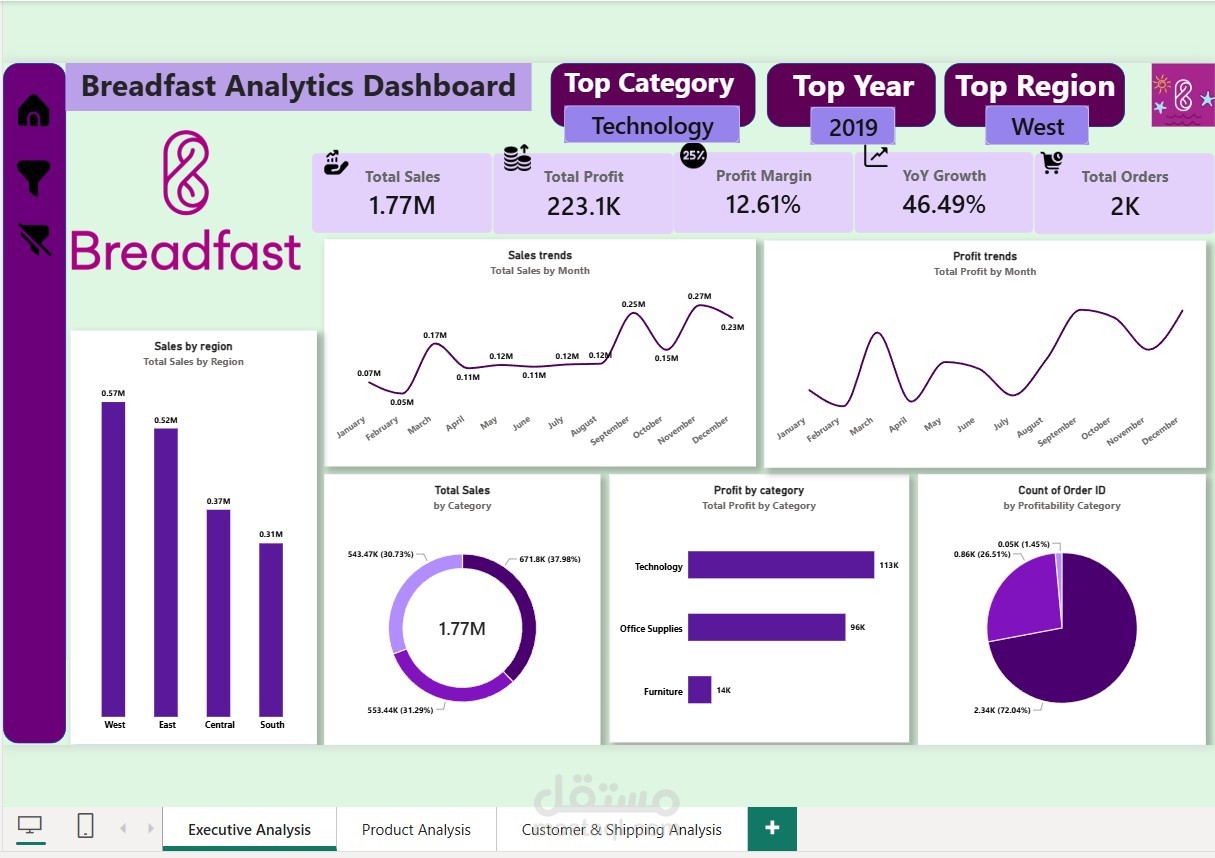
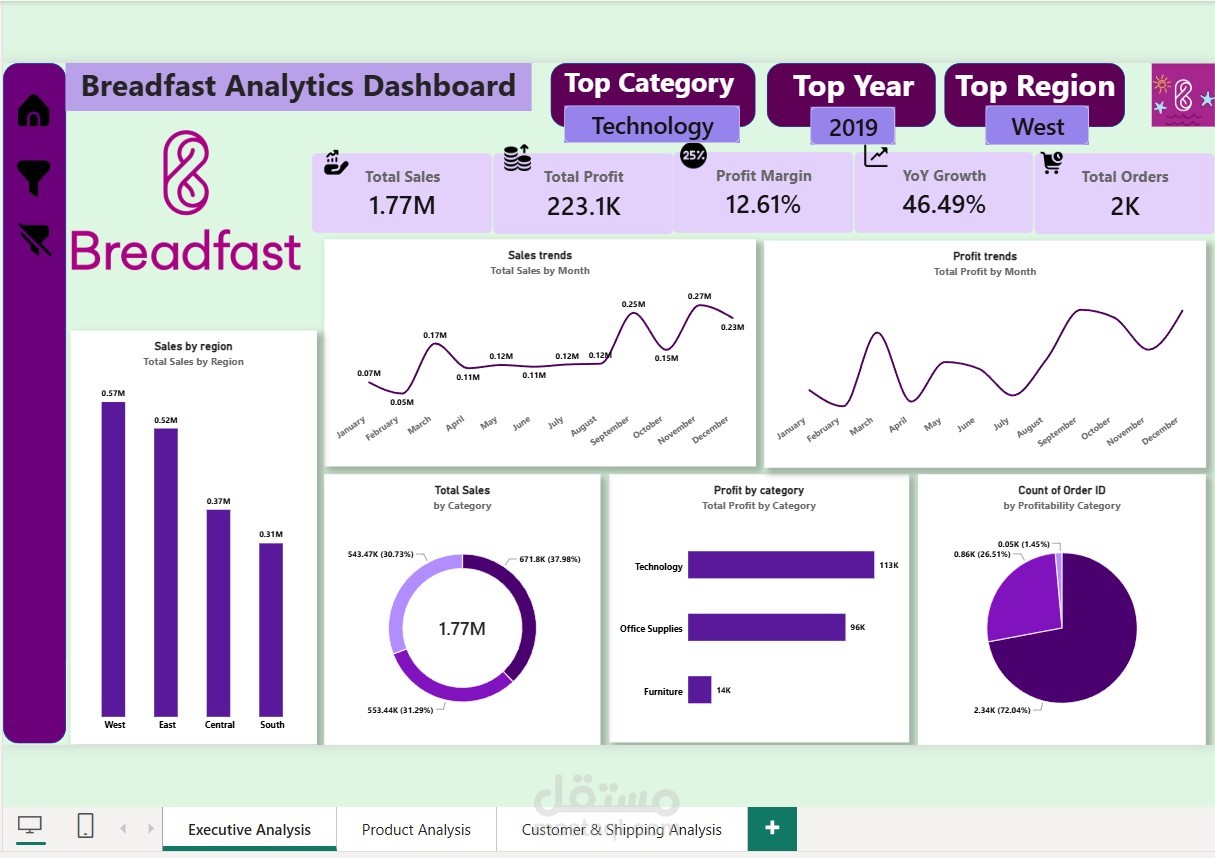
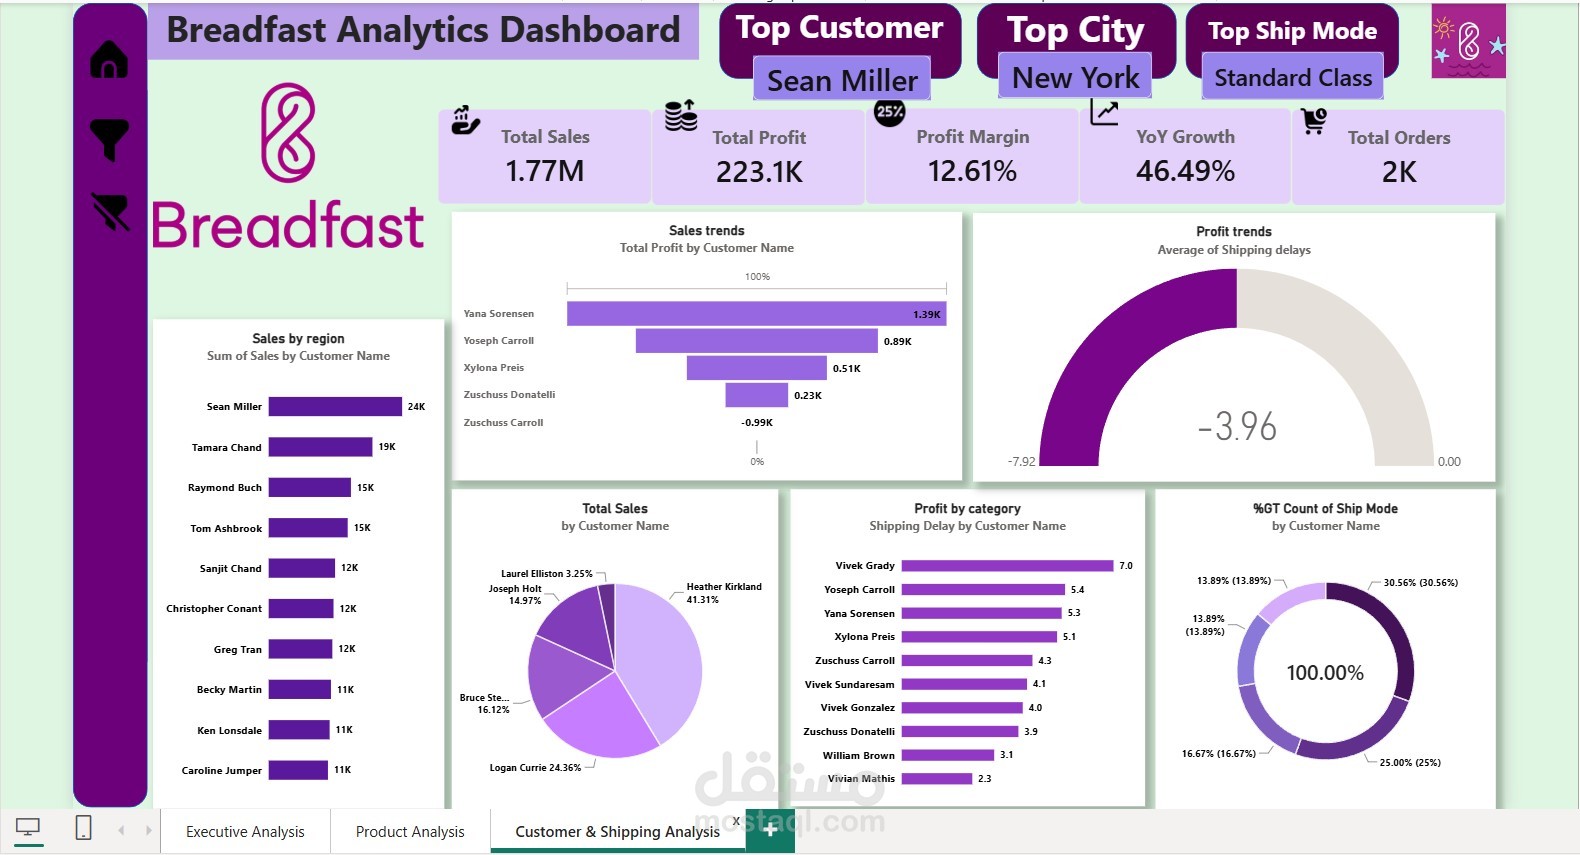
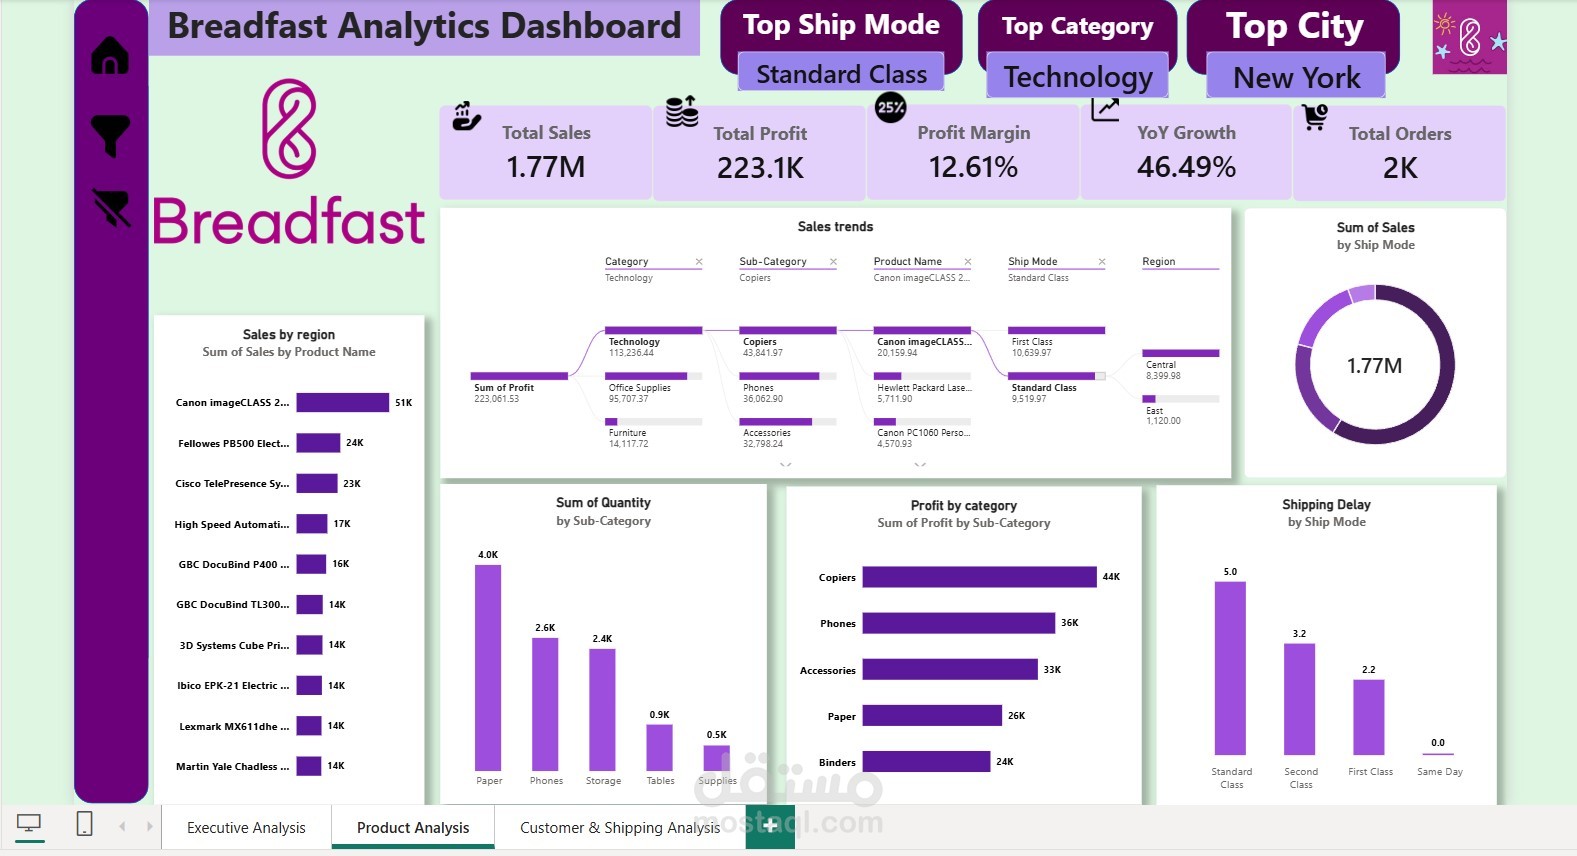
An interactive Power BI dashboard designed to analyze sales performance, customer behavior, profitability, and shipping trends. The dashboard provides key business insights through dynamic KPIs, customer analysis, sales trends, profit analysis, and shipping performance visualizations.
Key Features:
Total Sales, Total Profit, Profit Margin, YoY Growth & Total Orders KPIs
Top Customer, Top City & Top Ship Mode
Customer sales and profit analysis
Shipping delay analysis
Interactive and dynamic visualizations
Business-focused insights for better decision-making