Marketing Campaign Performance Dashboard
تفاصيل العمل
Project Overview
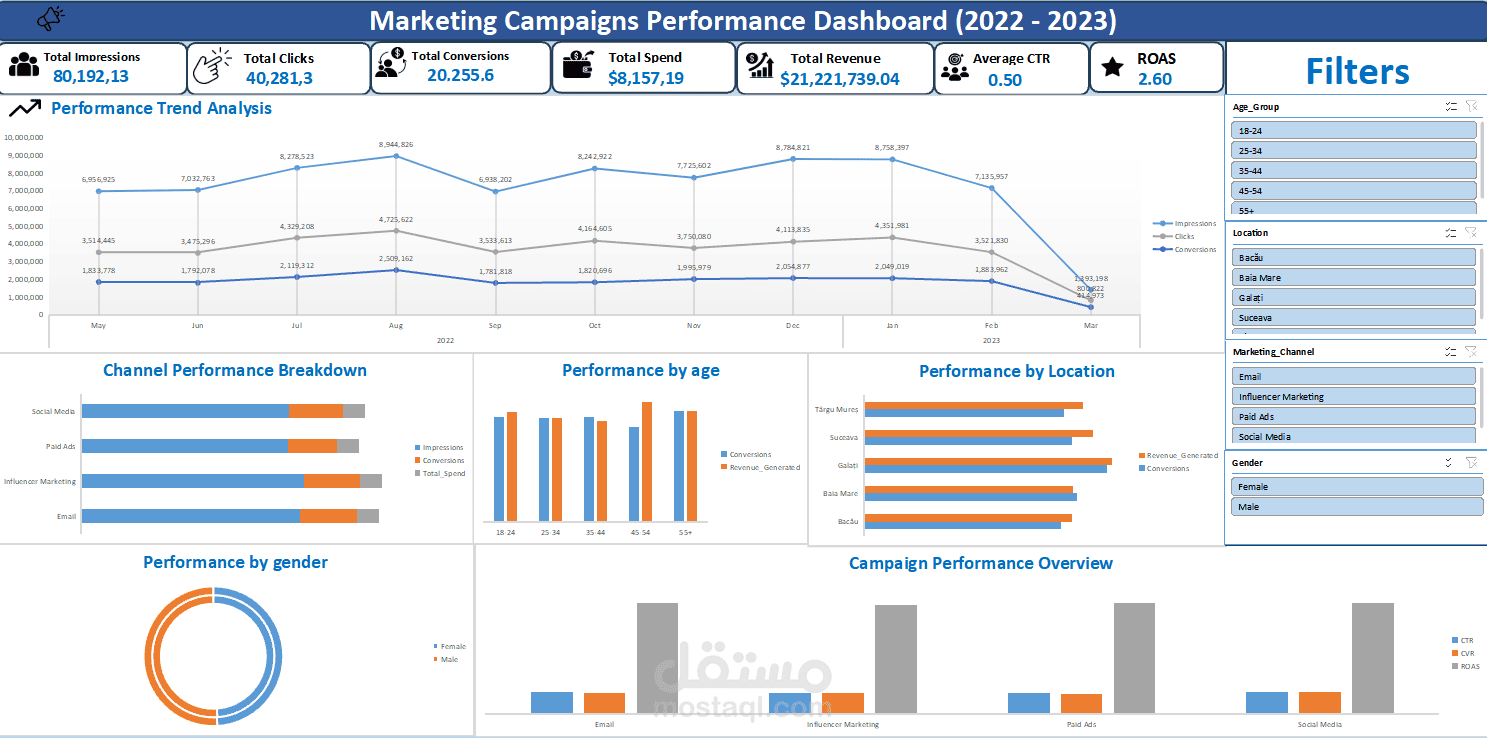
Designed and developed an interactive Excel Marketing Performance Dashboard to analyze multi-channel campaign performance across demographics, regions, and time periods (2022–2023). The dashboard tracks key advertising metrics, profit/revenue drivers, conversion rates, and overall return on ad spend (ROAS) to optimize marketing strategy.
Key Performance Indicators (KPIs)
Total Impressions: 80,192,131
Total Clicks: 40,281,300
Total Conversions: 20,255,600
Total Spend: $8,157,199.26
Total Revenue Generated: $21,221,739.04
Average CTR: 0.50 (50%)
Average ROAS: 2.60 (260%)
Business Analysis & Dynamic Capabilities
Time-Based Performance Trend: Modeled monthly performance trends for impressions, clicks, and conversions across 2022 and 2023.
Channel Performance Breakdown: Compared efficiency across Social Media, Paid Ads, Influencer Marketing, and Email.
Demographic Analysis: Evaluated conversion rates and revenue generated across age groups (18–24, 25–34, 35–44, 45–54, 55+) and gender.
Regional Performance Analysis: Analyzed location-based performance across key cities (Galați, Târgu Mureș, Suceava, Baia Mare, Bacău).
Interactive Slicers & Filtering: Implemented dynamic filtering by Age Group, Location, Marketing Channel, and Gender.
Business Insights & Recommendations
Top Demographics: The 25–34 age group represents the most profitable and efficient demographic, delivering high CVR (53%) and top ROAS (261%).
Channel Optimization: Email and Paid Ads showed high consistency in CVR and ROAS across multiple segments.
Budget Allocation: Recommended reallocating budget toward Female audiences and the 25–34 age bracket to maximize total revenue and return on investment.
Tools & Technologies Used
Microsoft Excel (Pivot Tables, Calculated Fields, Advanced Formulas, Dynamic Slicers, Dashboard Design & Data Visualization).