Financial Analysis and Valuation
تفاصيل العمل
1. Project overview
Objective. Build a complete, auditable valuation of Edita Food Industries (EGX: EFID), an Egyptian packaged-snacks manufacturer (Tiger Tail, Twinkies, Todo, HoHos, Molto, Freska, Bake Rolz), starting from the raw published financial statements and ending with an intrinsic value per share compared with the market price.
What I produced.
1. A consolidated financial-statement workbook covering FY2023, FY2024, FY2025 and H1 2026 (with H1 2025 as the like-for-like comparison): balance sheet, income statement and cash flow statement.
2. A ratio-analysis sheet with about 45 live-formula ratios in eight groups.
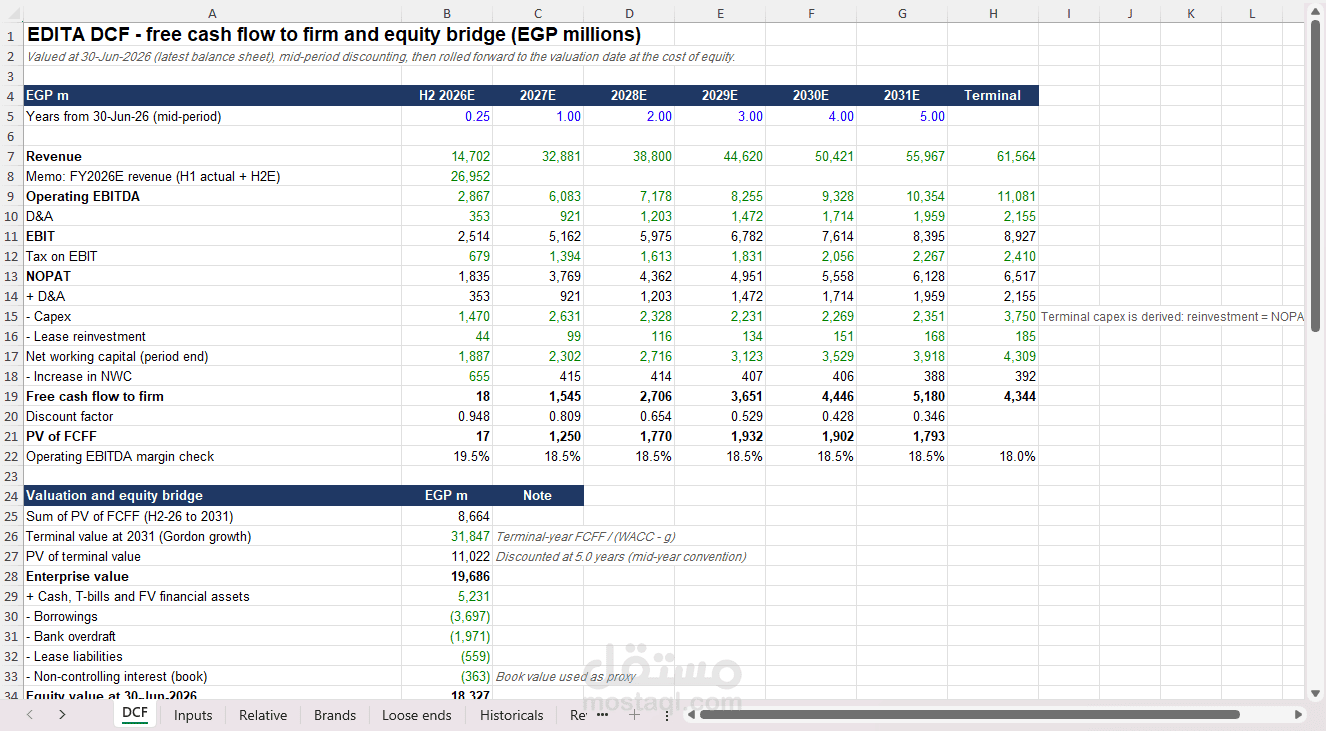
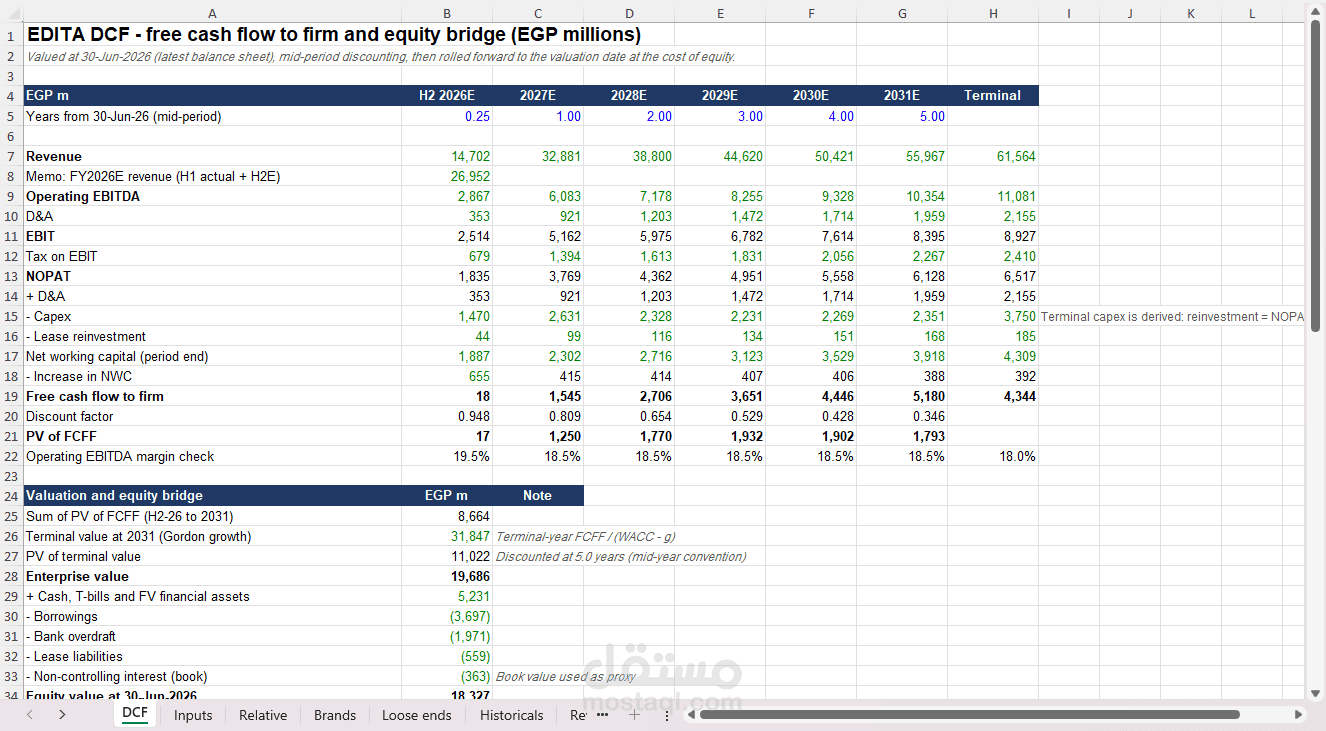
3. A discounted cash flow (DCF) model with a mid-period timing convention, WACC build-up, terminal value, equity bridge and sensitivity tables.
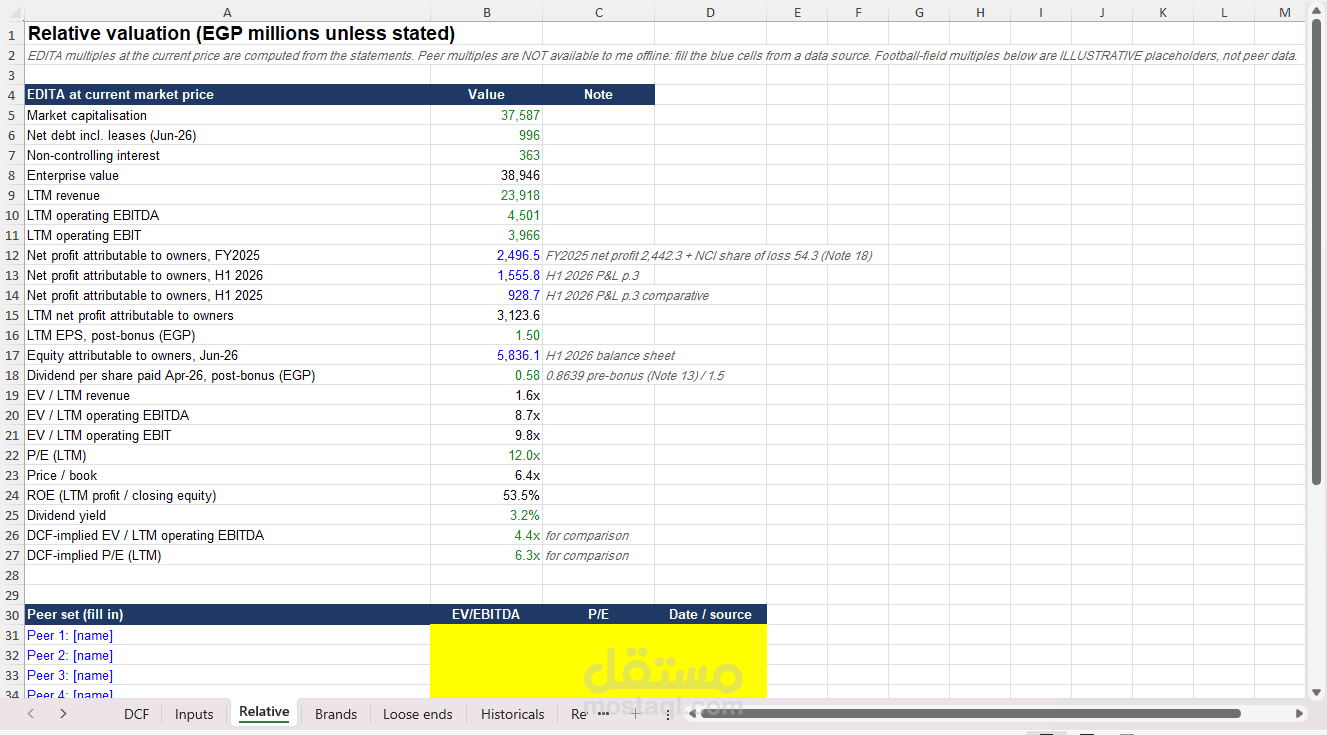
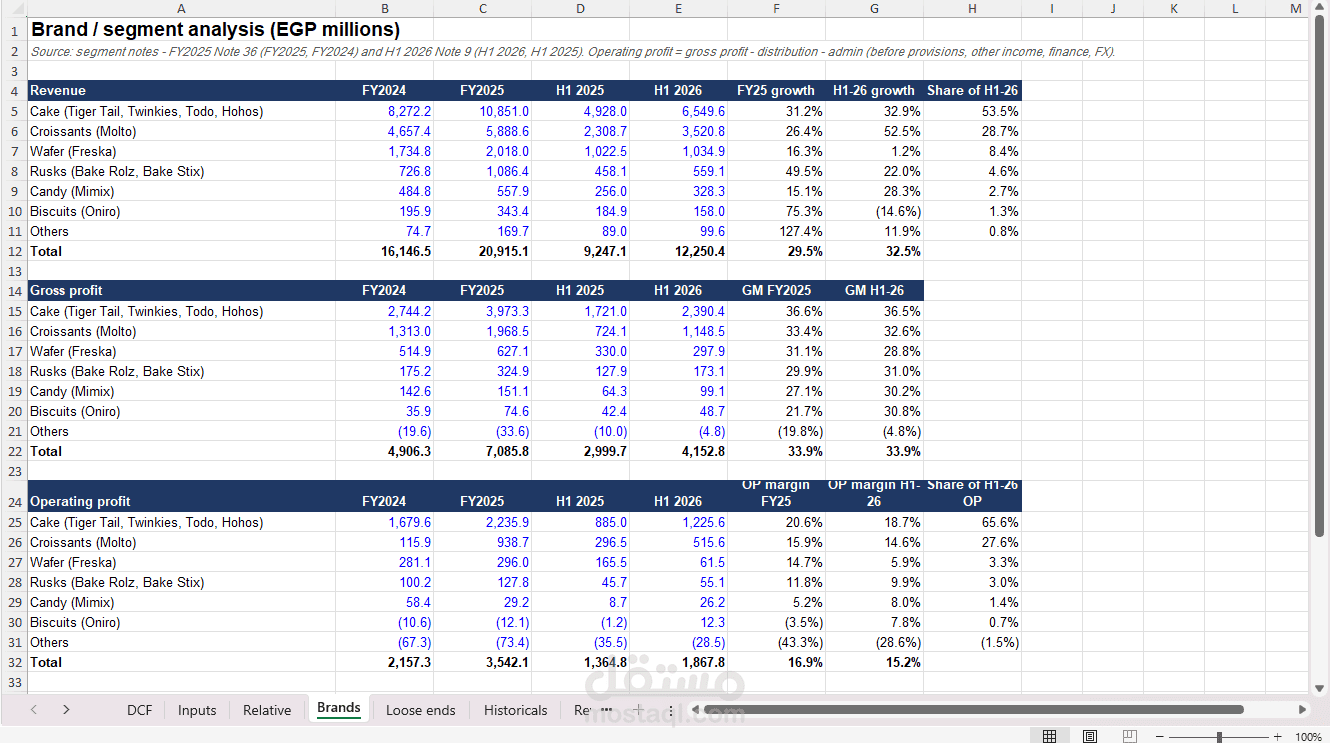
4. A supporting analysis of brand/segment profitability and a relative-valuation framework.
5. A documented review-and-revision cycle on the discount rate and terminal value.
Tools. Microsoft Excel (formulas, cross-sheet links, sensitivity tables), PDF source documents, and an AI assistant (Claude) used for data extraction, workbook construction and model review (see Section 9).
2. Data collection and preparation
Sources. Four filings, all prepared under IFRS:
• FY2024 consolidated financial statements (audited by Grant Thornton)
• FY2025 consolidated financial statements (audited)
• Condensed interim financial information for the six months to 30 June 2026 (reviewed under ISRE 2410, not audited)
• FY2023 figures from the FY2024 report's comparative columns
Preparation steps.
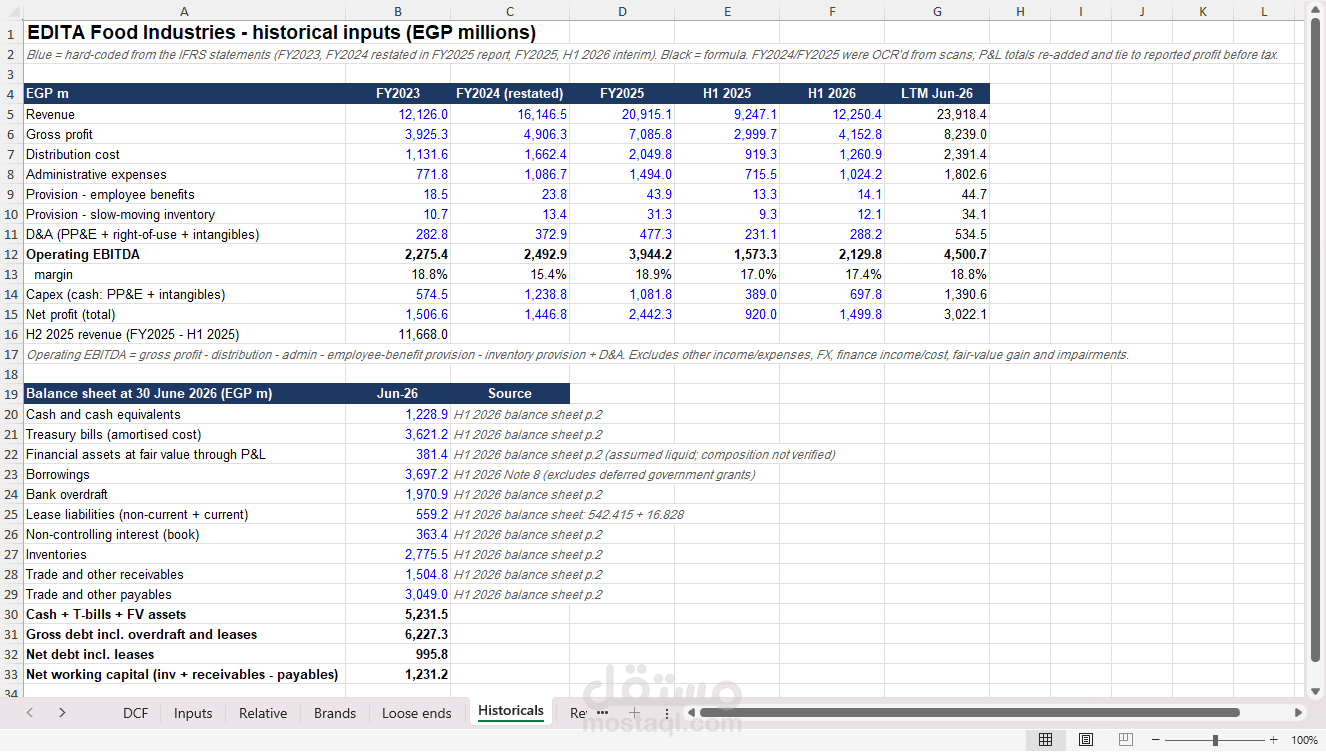
• Read the scanned PDFs page by page and typed the three primary statements into a consistent line-item structure, so every period lines up row by row.
• Used the latest restated figures where the company had restated them (FY2024 was restated in the FY2025 report; net profit moved from EGP 1,415m to EGP 1,447m).
• Mapped different presentations onto one layout (for example, combining separate impairment lines in H1 2026 into one line).
• Replaced all totals with formulas, then built a Checks sheet that compares each recomputed total with the figure printed in the filing: total assets, equity, liabilities, gross profit, profit before tax, net profit, each cash-flow subtotal, and closing cash against balance-sheet cash less overdraft.
Data-quality issues found and documented (rather than silently corrected):
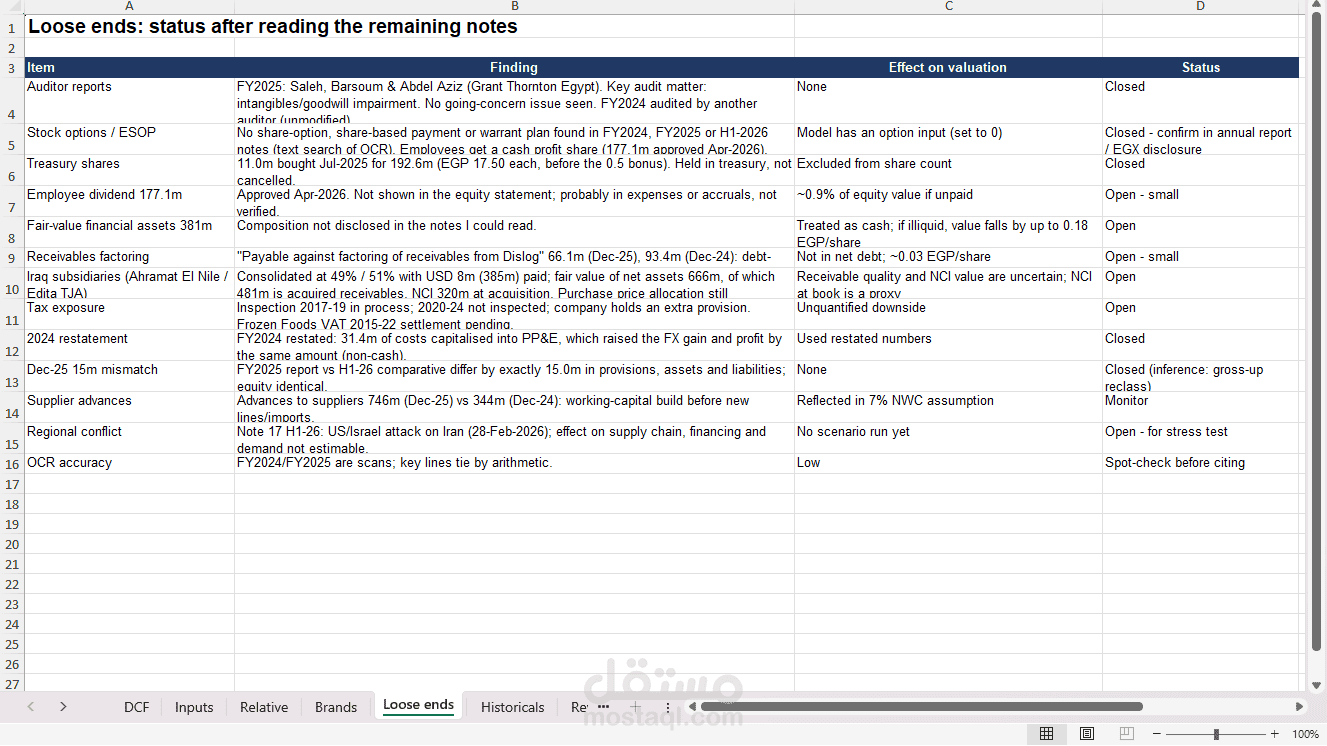
• The FY2024 cash flow statement starts from a profit-before-tax figure EGP 100,000 different from the income statement.
• The reported FY2025 EPS (2.16) implies about 1,154m shares, whereas ordinary shares less treasury shares are 1,389m, which gives roughly EGP 1.80. I used the second figure in the analysis and flagged the discrepancy.
• The Q2 2026 report shows 31 Dec 2025 receivables and provisions each EGP 15m lower than the audited FY2025 report. I used the audited figures.
• Bonus issues changed the share count (a 1-for-1 issue before FY2025 and an approved 0.5-for-1 issue in April 2026), so per-share figures were adjusted consistently.
3. Financial statement analysis: key findings
Metric
FY2023
FY2024 (restated)
FY2025
H1 2026
Revenue
12,126
16,147
20,915
12,250
Gross margin
32.4%
30.4%
33.9%
33.9%
EBITDA
2,288
2,509
3,965
2,189
EBITDA margin
18.9%
15.5%
19.0%
17.9%
Net profit
1,507
1,447
2,442
1,500
• Growth. Revenue grew at a compound rate of about 31% a year between FY2023 and FY2025, and H1 2026 revenue was 32.5% above H1 2025. Much of this is price-driven in a high-inflation currency, so real volume growth is lower.
• Margins. Margins dipped in FY2024 under cost pressure and recovered strongly in FY2025.
• Cash flow. FY2025 operating cash flow was exceptionally strong (EGP 4,377m), helped by lower inventory and longer supplier credit, so I treated it as partly non-recurring.
• Investment. Capex ran at 5% to 8% of revenue and above 2x depreciation in every period, showing a business in a capacity-expansion phase.
• Balance sheet. Gross debt rose with expansion, but large treasury-bill holdings kept net debt/EBITDA low (0.07x at FY2025).
4. Ratio analysis
Eight groups, all driven by formulas linked to the statement sheets: liquidity, profitability, efficiency, leverage and solvency, cash flow, growth, DuPont decomposition, and per-share/market ratios. Return and turnover ratios use average balances; H1 2026 flow ratios are annualised with an adjustable factor.
Ratio
FY2024
FY2025
H1 2026
Current ratio
1.59x
1.68x
1.52x
Cash conversion cycle (days)
47
30
13
Return on equity (owners)
40.5%
52.8%
54.8%
Debt / equity
0.92x
0.85x
1.01x
Interest coverage (EBIT / finance cost)
5.3x
5.8x
5.5x
Interpretation. Liquidity is comfortable and working-capital efficiency has improved sharply, although part of that comes from stretching supplier payment terms. Returns are very high. DuPont analysis shows they come from a healthy net margin plus moderate leverage rather than from leverage alone. The main watch-point is that debt-to-equity is at the 1.0x covenant limit mentioned in the filings, even though net debt is small because of cash holdings.
5. DCF valuation methodology
Approach. Free cash flow to the firm (FCFF) forecast for H2 2026 and then 2027 to 2031, discounted at WACC, plus a terminal value, bridged from enterprise value to equity value per share.
Step by step.
1. Timing. Valuation as at 30 June 2026 (the latest balance sheet), with a stub period for H2 2026, mid-period discounting (0.25, 1, 2, 3, 4, 5 years) and a final roll-forward of equity value to 1 November 2026 at the cost of equity.
2. Forecast. Revenue growth fading from 26% in H2 2026 and 22% in 2027 to about 11% by 2031; EBITDA margin about 18.5%; D&A, capex, lease reinvestment and working capital as percentages of revenue. FCFF = EBITDA less D&A, taxed at 27%, plus D&A, less capex, lease reinvestment and the increase in net working capital.
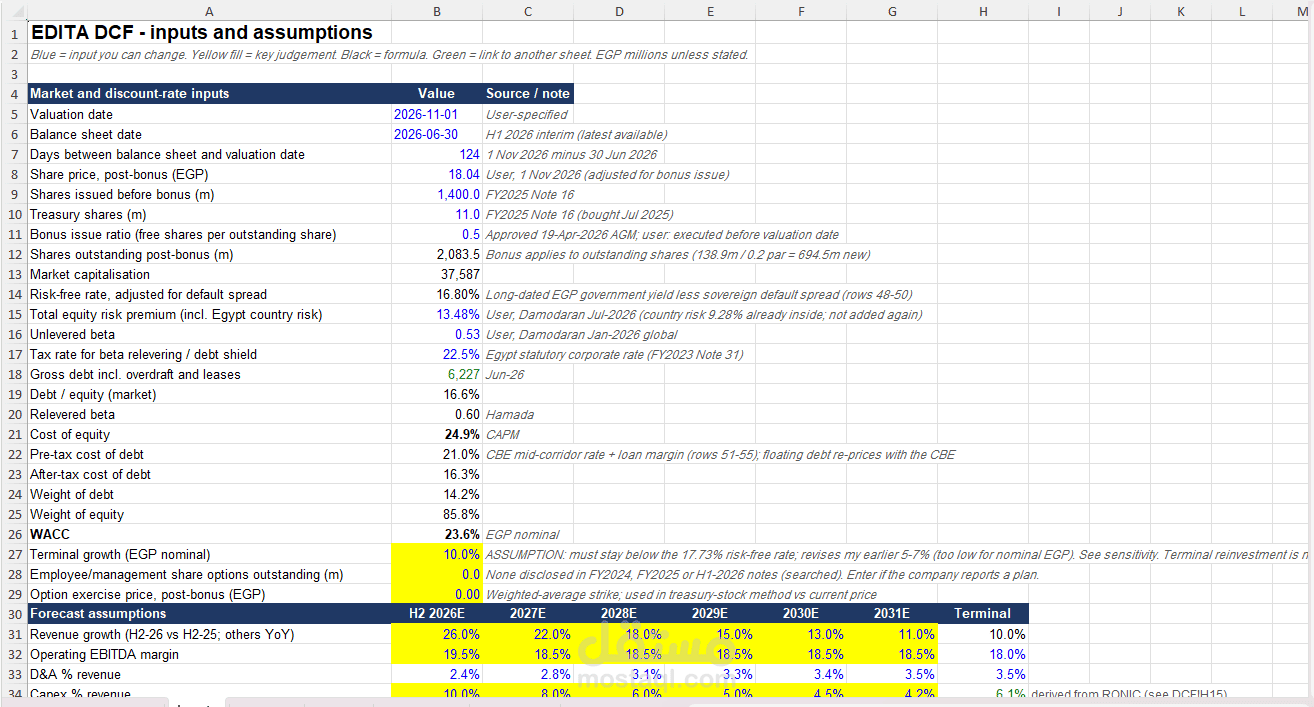
3. WACC. Cost of equity by CAPM using a default-spread-adjusted EGP risk-free rate, an equity risk premium that includes country risk, and a re-levered industry beta. Cost of debt built from the central bank's corridor rate plus Edita's loan margin. Market-value capital weights.
4. Terminal value. Gordon growth at 10% nominal EGP growth, with terminal reinvestment tied explicitly to a return on new capital: terminal FCFF = NOPAT x (1 - g / RONIC).
5. Equity bridge. Enterprise value plus cash, treasury bills and fair-value investments, less borrowings, overdraft, lease liabilities and non-controlling interests, divided by bonus-adjusted shares outstanding.
6. Checks and sensitivities. WACC-versus-growth table built from live formulas, a RONIC sensitivity table, an implied-multiple cross-check against the market, and a reconciliation cell proving the table's centre equals the model output.
Key assumptions (revised model).
Input
Value
Risk-free rate (10-year yield less default spread)
16.8%
Equity risk premium (incl. country risk)
13.5%
Re-levered beta
0.60
Cost of equity
24.9%
Pre-tax cost of debt
21.0%
WACC
23.6%
Terminal growth
10%
Terminal return on new capital (RONIC)
30%
Results.
• PV of 2026 to 2031 cash flows: about EGP 8.7bn; PV of terminal value: about EGP 11.0bn (56% of enterprise value).
• Enterprise value: about EGP 19.7bn.
• Equity value per share: EGP 9.49 against a market price of EGP 18.04.
6. Review and revision of the model
I submitted the model for a structured review and then revised the two issues that mattered most:
Discount rate. The risk-free rate was originally taken from a 91-day treasury bill, a short-tenor rate used to value long-lived cash flows. I rebuilt it from the 10-year government yield minus an explicit default spread. The cost of debt was rebuilt from the central bank's corridor after its October 2026 rate hike. WACC moved from 24.55% to 23.64%.
Terminal value. The original terminal reinvestment implied a return on new capital of about 65%, well above Edita's current return on invested capital of roughly 40%. Capex in the terminal year is now derived so that growth is genuinely paid for. This lowered the terminal multiple.
Net effect. Value per share moved from EGP 10.24 to EGP 9.49. A lower risk-free rate raised value, and consistent reinvestment lowered it by more. All changes are recorded in a revision log sheet inside the workbook.
7. Interpreting the result
The DCF value is well below the market price, and the revision did not close the gap. The cost of equity is only about 1.5 percentage points above the 10-year sovereign yield, so the discount rate is not obviously too high. Plausible explanations are that the market expects faster or longer growth than the five-year forecast, that it applies a lower required return, or that Egyptian equities carry a scarcity premium for investors seeking inflation protection. I treat the result as a conservative reference point to be tested, not as a verdict that the stock is overvalued.
8. Limitations and next steps
• The 10-year yield and default spread need refreshing on the valuation date, since rates moved after the central bank's 29 October decision.
• RONIC, terminal growth and the working-capital assumption are judgements, with a sensitivity table for the first two.
• A few debt-like items (employee-benefit obligations, employee profit share, factoring payable) are not yet in the equity bridge.
• The relative-valuation sheet needs peer multiples, which would give a market cross-check.
• Next step: extend the explicit forecast with a fade period and add scenarios (base, upside, downside).
9. Tools and AI assistance
I used an AI assistant (Claude) to help extract figures from the scanned filings, build the statements and ratio workbook, and review the DCF. I built the valuation logic, took responsibility for every assumption, and made the final judgement calls. All cells are formula-driven and sourced, and I can explain each step.
10. Skills demonstrated
• Reading and reconciling IFRS financial statements, including restated comparatives
• Spreadsheet modelling: linked sheets, formula-driven checks, sensitivity analysis
• Ratio analysis and DuPont decomposition
• DCF valuation: FCFF, WACC/CAPM for an emerging market, mid-period discounting, terminal value, equity bridge
• Emerging-market valuation issues: high inflation, country risk, currency effects, bonus-share adjustments
• Critical review: identifying and fixing inconsistent assumptions, and documenting data issues transparently