📊 Sales Analysis Dashboard | Microsoft Excel
تفاصيل العمل
📊 Sales Analysis Dashboard | Microsoft Excel
I'm excited to share one of my Data Analysis projects, completed as part of the Data Analysis Training Program at the National Telecommunication Institute (NTI).
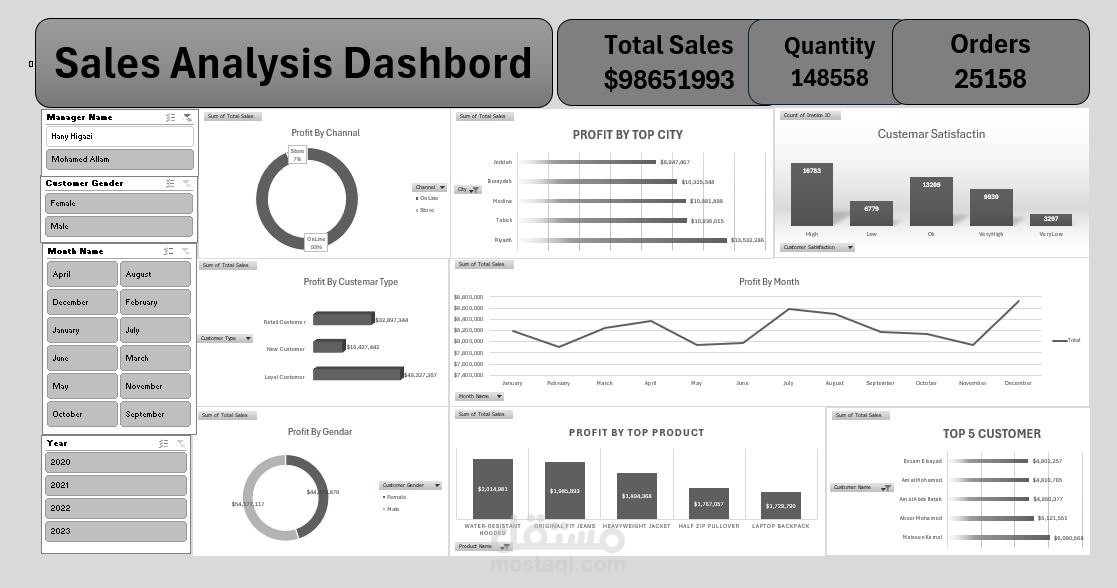
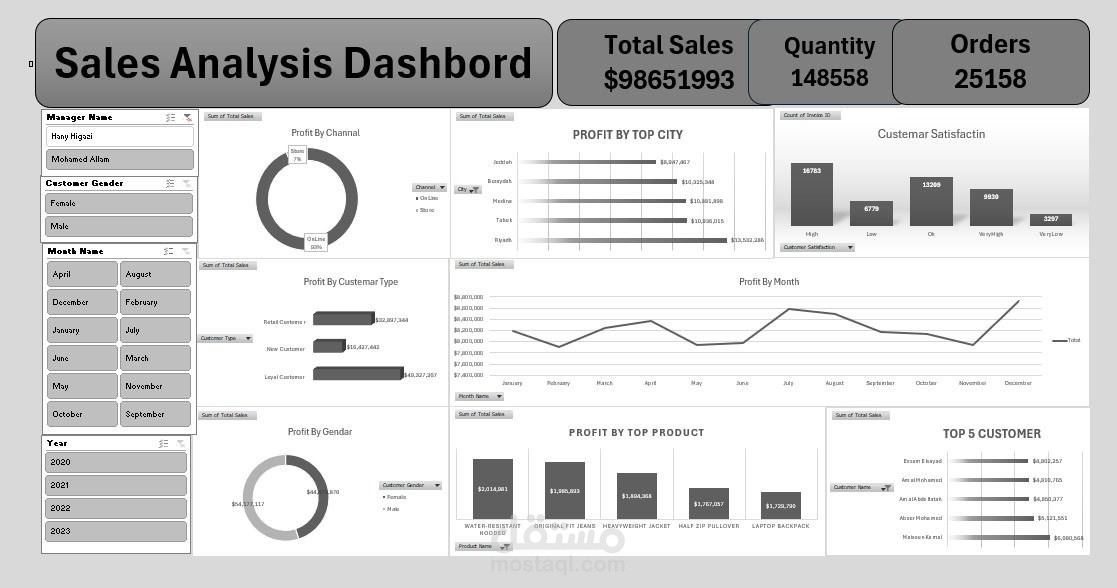
In this project, I built an interactive Sales Analysis Dashboard using Microsoft Excel to analyze sales performance, track key business metrics, and generate actionable insights that support data-driven decision-making.
📌 Key Insights Covered:
Total Sales, Quantity, and Orders Overview
Profit Analysis by Sales Channel
Profit by Top Cities
Customer Satisfaction Analysis
Profit by Customer Type
Monthly Profit Trends
Profit Distribution by Gender
Top Performing Products
Top 5 Customers Analysis
Interactive Filters (Manager, Gender, Month, and.
year)
🛠️ Skills Applied:
Data Cleaning & Preparation
Data Analysis
Pivot Tables & Pivot Charts
Dashboard Design
Data Visualization
KPI Tracking
Interactive Slicers
This dashboard helps stakeholders monitor business performance, identify profitable products and customers, analyze sales trends, and make informed business decisions.