Product Data Analysis(Excel)
تفاصيل العمل
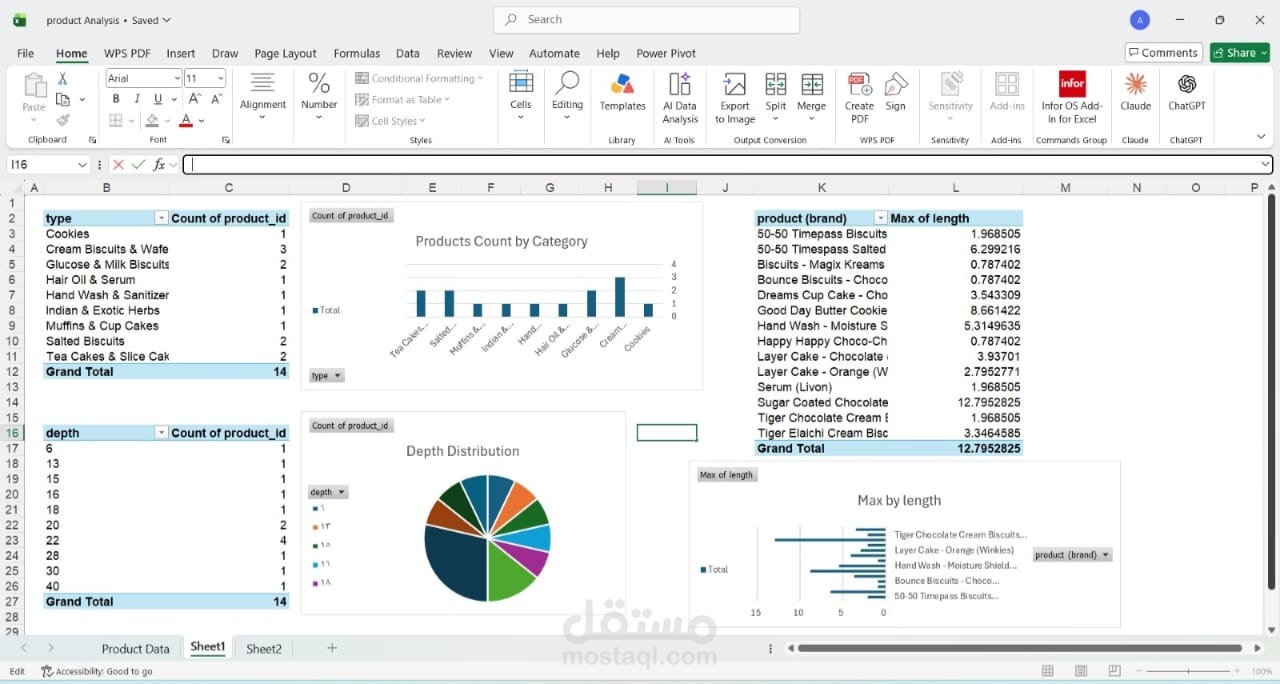
This project presents a clear and structured visual analysis of product data in Excel using dynamic Pivot Tables, customized Pivot Charts, and interactive filtering.
Key Components & Analysis:
Pivot Tables & Analytics:
Products Count by Category: Calculated the total count of products (product_id) for each product category.
Average Length by Category: Analyzed the average length (length) of products across categories.
Depth Distribution: Computed product counts for each depth dimension (depth).
Max Length by Brand: Identified the maximum product length (Max of length) per brand (product (brand)).
Pivot Charts & Visual Layout:
Visualized the data using a combination of Column Charts, a Bar Chart, and a Pie Chart.
Removed gridlines from the sheet to ensure a clean, professional design.