Interactive Sales Dashboard | Excel Data Analysis & Visualization
تفاصيل العمل
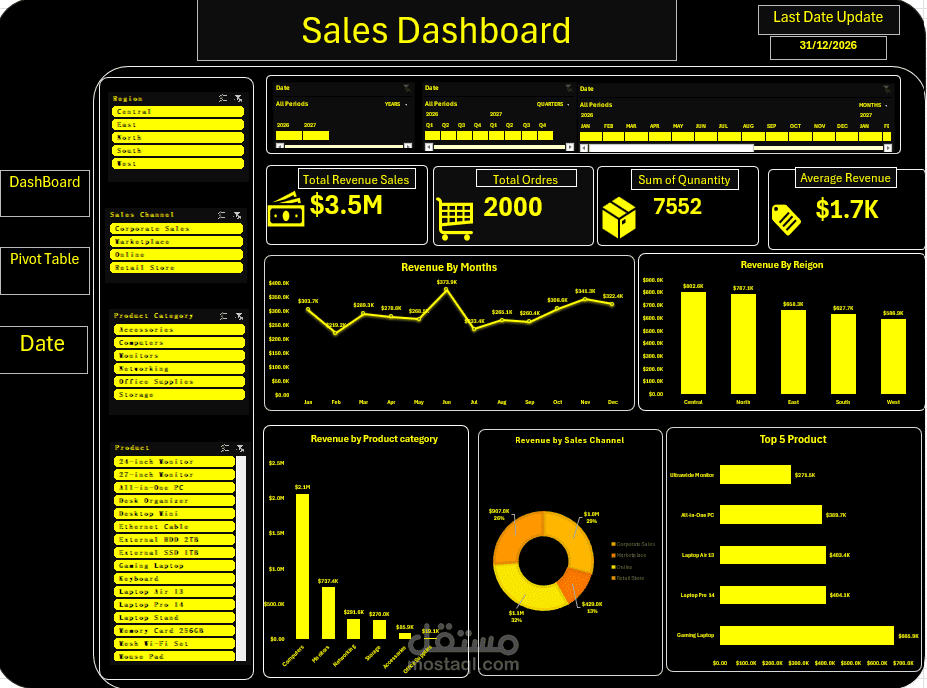
Created an interactive Sales Dashboard using Microsoft Excel to analyze and visualize sales performance. The dashboard includes:
Total Revenue & Total Orders
Total Quantity and Average Revenue
Monthly Revenue Analysis
Revenue by Region
Revenue by Product Category
Revenue by Sales Channel
Top 5 Products by Revenue
Interactive filters and slicers for dynamic analysis
Clean and professional dashboard design for easy understanding of sales KPIs