Corporate Expense Control Dashboard | Power BI - $3.05M Expense Tracking & Pending Analysis
تفاصيل العمل
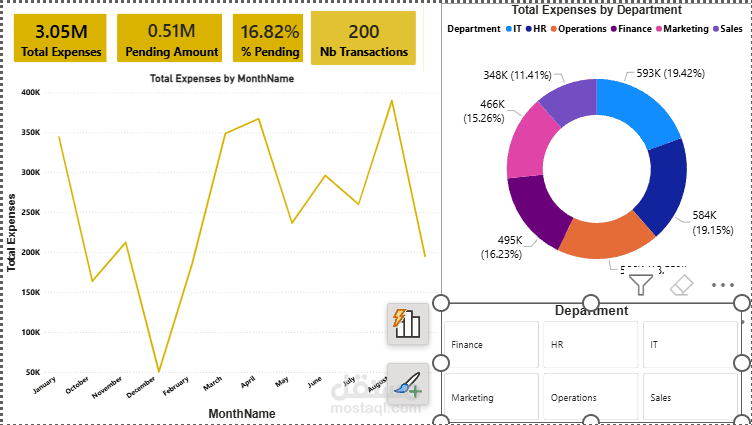
This is a Power BI financial control dashboard built to track and analyze $3.05M in total corporate expenses across 200 transactions.The main business problem was: High pending expenses (16.82%), lack of visibility on which department spends the most, and extreme monthly fluctuations that hurt cash flow.The dashboard provides real-time expense monitoring by month and by department with pending amount tracking.Tools & Software Used:Advanced Excel, Power Query, PivotTables, VBA for automationData Modeling, ETL Processes, Data Cleaning, Data VisualizationPower BI, DAX, KPI Tracking, IBM Cognos Analytics, TableauSQL, Python for Data Analysis for audit and validationAI Data Annotation, AI Training DataExecution Method & Steps:ETL & Cleaning: Imported 200 transactions from Excel/ERP. Used Power Query to clean Department names (IT, HR, Operations, Finance, Marketing, Sales), remove duplicate transactions, and standardize MonthName. Created a column to flag Pending vs Approved.Data Modeling: Built a dimensional model with Fact_Expenses and Dim_Department, Dim_Date. Created calculated measures for pending analysis.DAX Measures: Created KPIs: Total Expenses = $3.05M, Pending Amount = $0.51M, % Pending = 16.82%, Nb Transactions = 200. Created Pending % = DIVIDE([Pending Amount],[Total Expenses]).Dashboard Design:KPI Cards: 4 cards showing Total Expenses, Pending Amount, % Pending, and Number of TransactionsLine Chart: Total Expenses by MonthName - Shows extreme volatility: High in January (340K), crash in December (50K), peak in August (390K)Donut Chart: Total Expenses by Department - IT $593K (19.42%) highest, HR $584K (19.15%), Finance $495K (16.23%), Marketing $466K (15.26%), Sales $348K (11.41%)Slicers: Department filter (Finance, HR, IT, Marketing, Operations, Sales) for interactivityValidation: Reconciled $3.05M total with accounting ledger. Confirmed pending calculation $0.51M / $3.05M = 16.82%. Screenshot is 100% my own work, no external links.Results & Key Insights:Critical Issue: $0.51M pending (16.82%) is too high - blocks month-end closing. Recommendation: Implement 7-day approval SLA to reduce pending to <5%Top Spending: IT Department $593K (19.42%) and HR $584K (19.15%) = 38.5% of total expenses. Need immediate budget audit for these twoMonthly Volatility: December dropped to $50K (data entry issue?) and August spiked to $390K - Indicates poor budgeting process. Recommendation: Implement monthly budget cap of $300KLowest Spend: Sales only $348K (11.41%) despite being revenue-generating - Suggests under-investment in SalesSavings Opportunity: By controlling IT and HR overspend and reducing pending, company can save ∼$120K per quarter