Superstore Executive Sales Dashboard | Excel
تفاصيل العمل
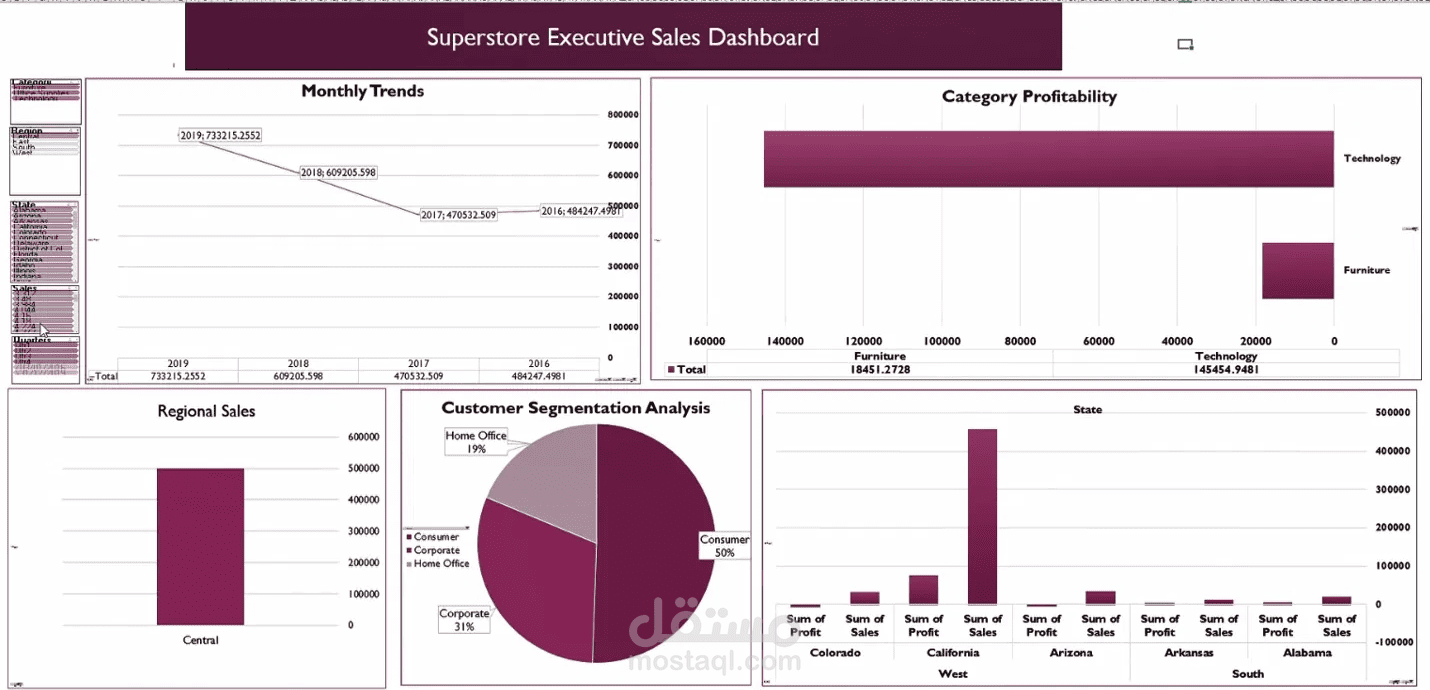
Work type: Interactive executive dashboard for retail sales and profit analysis, built entirely in Microsoft Excel using Pivot Tables, Pivot Charts and Slicers.
Overview
A single-screen dashboard that brings the key sales analyses together, so managers can see the sales trend, which categories and states earn the most, and which customer segments matter most, without opening the raw data.
What the dashboard shows
- Sales trend from 2016 to 2019, with 2019 the strongest year at about 733K
- Category profitability: Technology at about 145K vs. Furniture at about 18K
- Customer segmentation: Consumer 50%, Corporate 31%, Home Office 19%
- Sales by region
- Sales and profit by state
Key features
- Fully interactive: Slicers for category, region, state and quarter update every chart at once
- Everything on one screen, ready to present to management
- Each analysis lives in its own sheet with organized data, making it easy to edit and extend
- Consistent design with clear colors and titles
How I built it
1. Imported, reviewed and cleaned the Orders data
2. Built a Pivot Table for each analysis on its own sheet (sales trend, category profitability, customer segments, states)
3. Turned each Pivot Table into a suitable chart (line, bar, pie)
4. Added Slicers and connected them to all the Pivot Tables
5. Assembled the charts on one Dashboard sheet and formatted colors and titles
6. Checked every number for accuracy before delivery
Tools: Microsoft Excel, PivotTables, PivotCharts, Slicers, data cleaning, dashboard design
I can build a similar dashboard for your company's data, delivered on the agreed date with every number checked before hand-off.