project car
تفاصيل العمل
Project Description
Car Sales Analysis Dashboard – Power BI
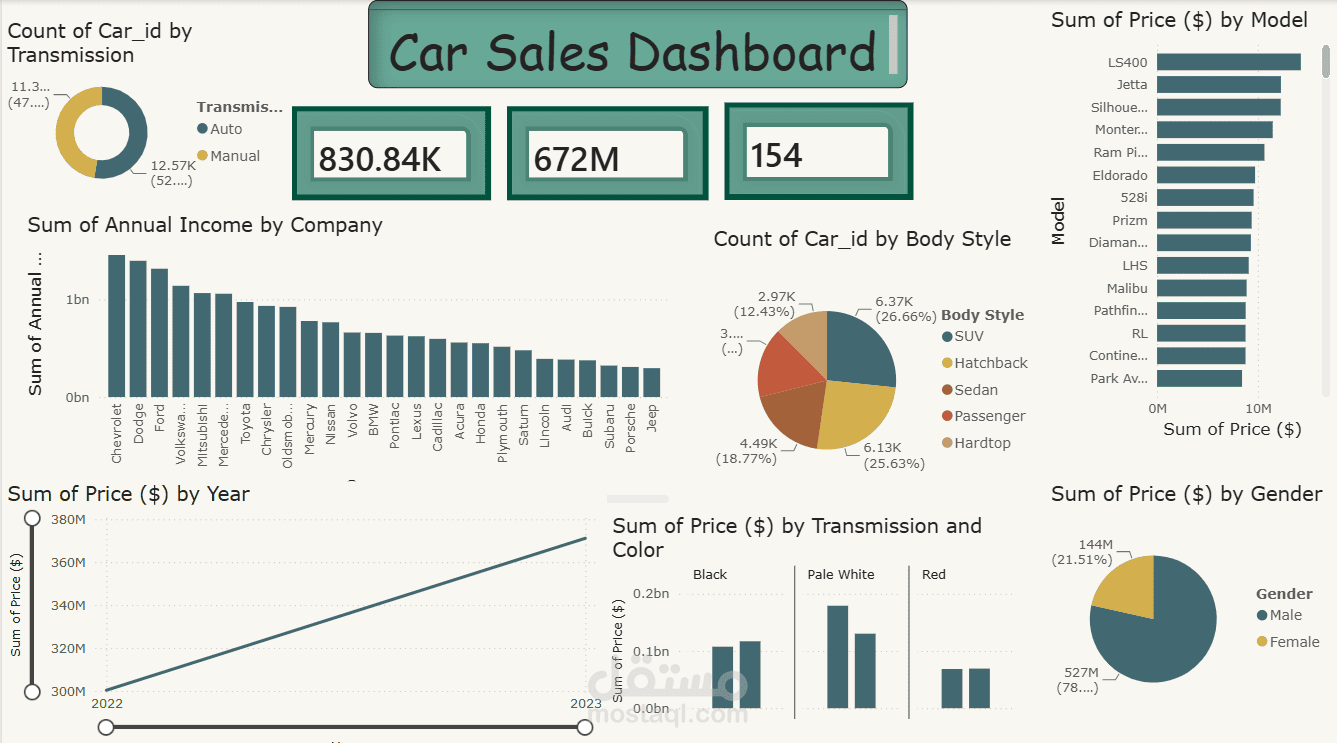
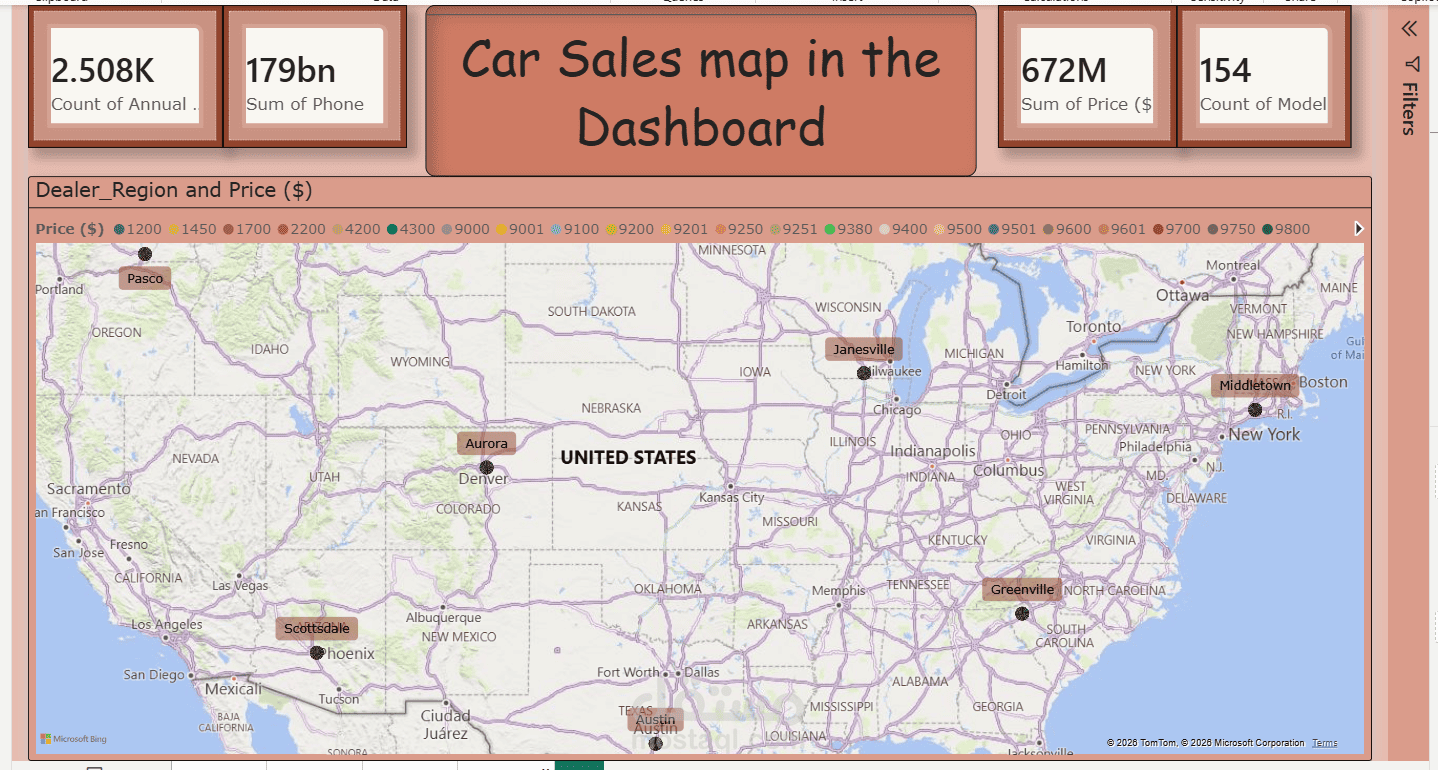
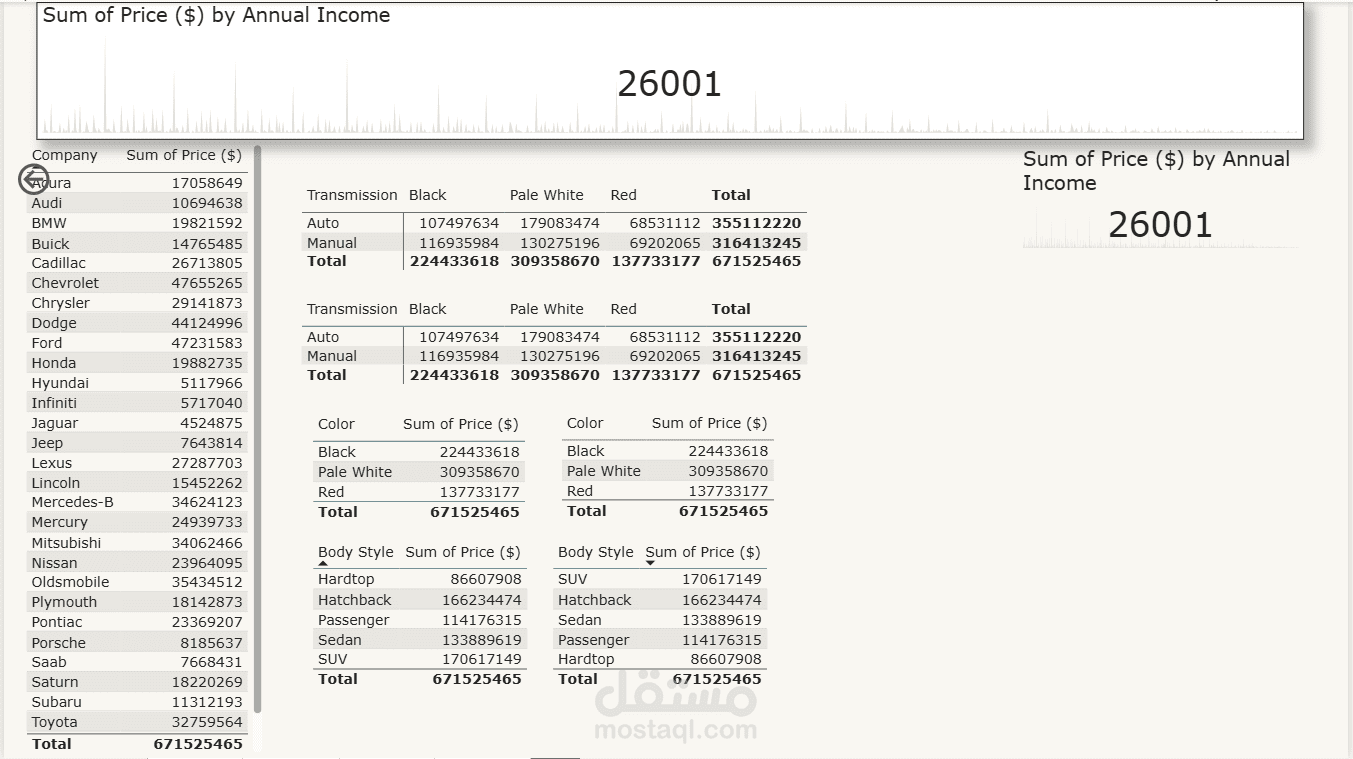
I developed an interactive Power BI dashboard to analyze and visualize car sales data. The dashboard provides clear insights into sales performance, pricing, customer demographics, car models, body styles, transmission types, and annual trends.
Key Features:
Created interactive KPIs for sales and pricing analysis
Analyzed car prices by model and year
Compared sales by transmission type and body style
Analyzed price distribution by gender
Visualized annual income by company
Created interactive charts and visualizations for easier data exploration
Designed a clean and user-friendly dashboard for data-driven insights
Tools & Skills:
Power BI | Data Analysis | Data Visualization | Excel | Dashboard Design
Project Goal:
Transform raw car sales data into an interactive dashboard that helps users understand sales patterns, pricing trends, customer segments, and overall market performance.