CVS pharmacy analysis
تفاصيل العمل
Overview
This is a Power BI sales analytics dashboard built for CVS Pharmacy, designed to track and analyze pharmaceutical product sales across the organization. It uses a dark theme with red accents (matching CVS branding) and is structured as a multi-page report with role-based navigation — meaning different users see different levels of detail depending on their position in the company.
Structure — 3 Report Pages (Role-Based Views)
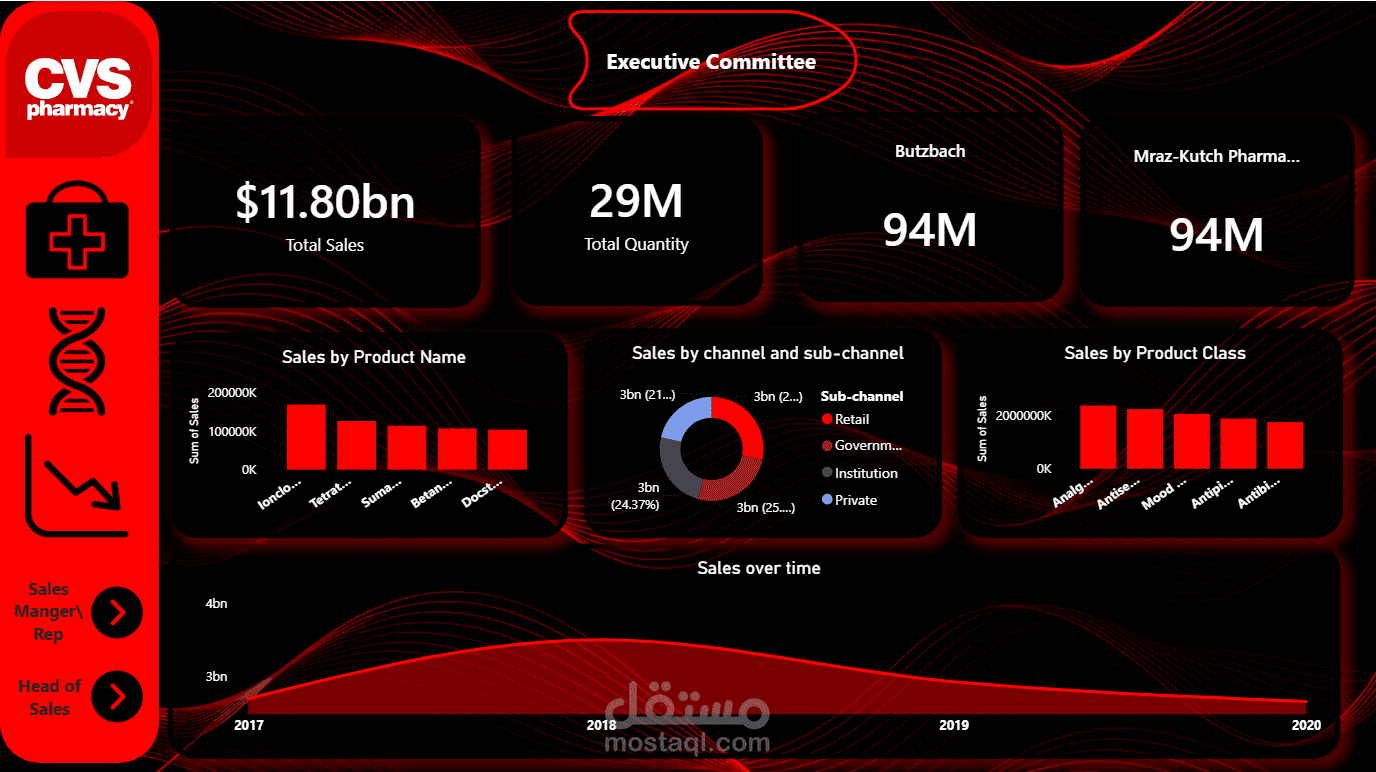
1. Executive Committee (top-level view)
The highest-level summary for leadership, showing:
KPI cards: Total Sum of Sales (12bn), Sum of Quantity (29M), and top performers (Butzbach, Mraz-Kutch Pharma)
Sales by Product Name (bar chart)
Sales by Channel and Sub-channel (donut chart: Retail, Government, Institution, Private)
Sales by Product Class (bar chart)
Sales Over Time (trend/area chart from 2017–2020)
Navigation buttons to drill down into "Sales Manager/Rep" and "Head of Sales" pages
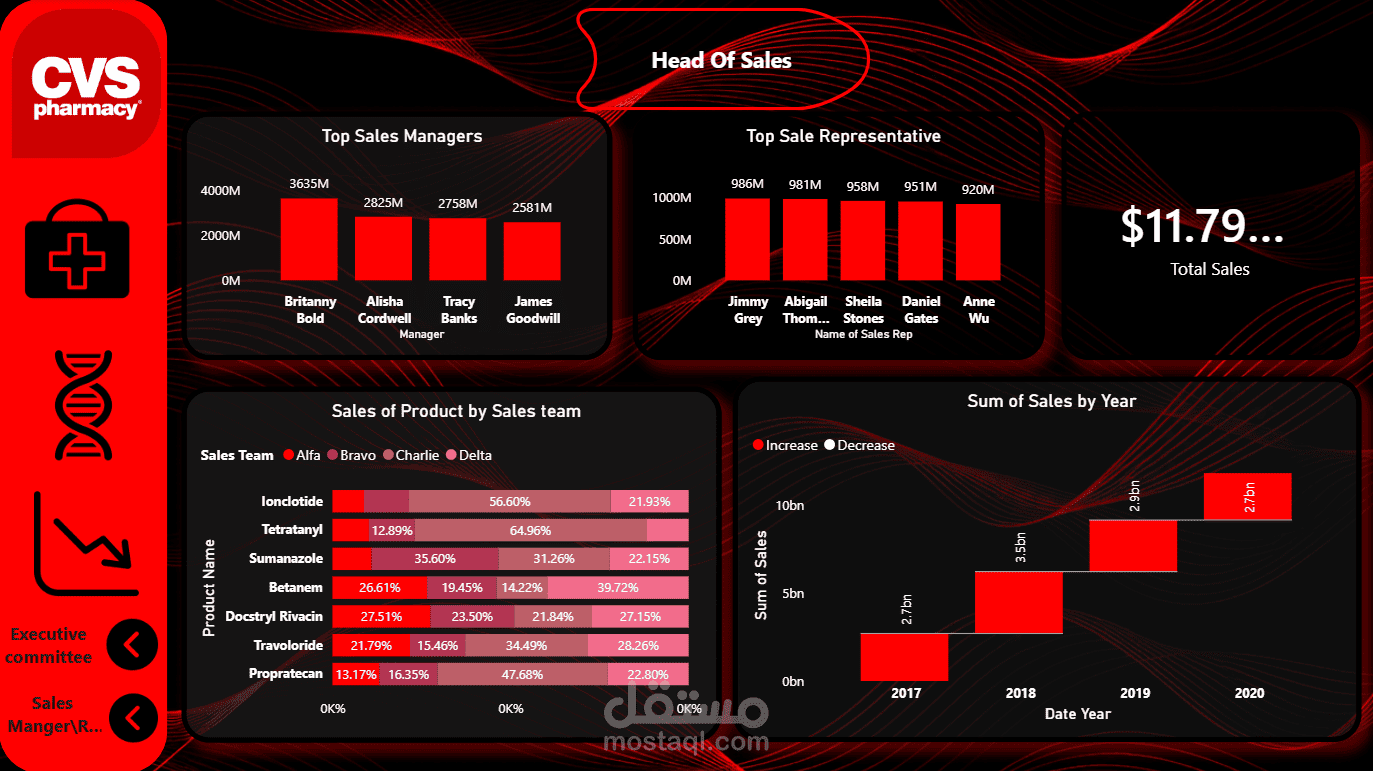
2. Head of Sales (mid-level management view)
Focused on team and product performance:
Top Sales Managers and Top Sales Representatives (ranked bar charts)
Total Sum of Sales (12bn KPI)
Sales of Product by Sales Team — a stacked/segmented bar breaking down product sales across teams (Alfa, Bravo, Charlie, Delta)
Sum of Sales by Year — a waterfall-style chart showing year-over-year increase/decrease (2017–2020)
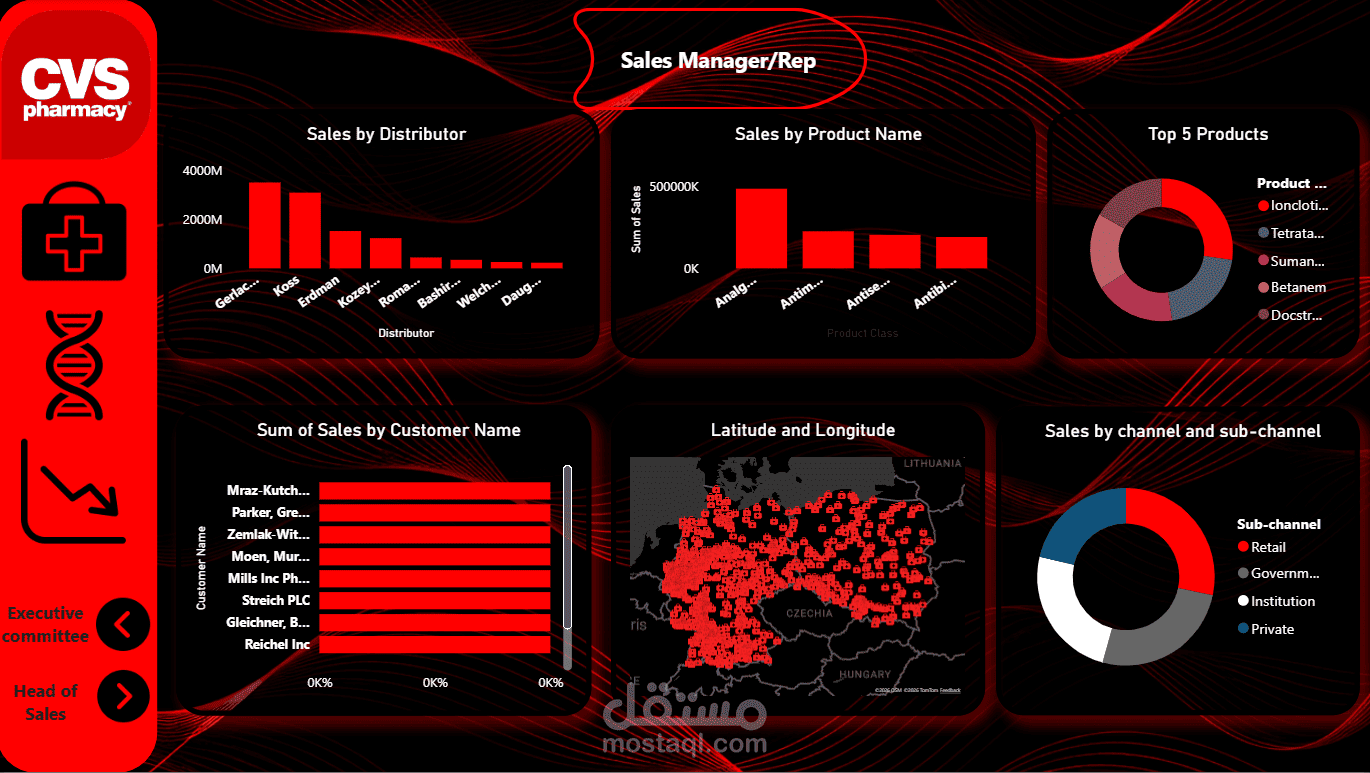
3. Sales Manager/Rep (operational/detail view)
The most granular level, likely for individual managers or reps to review their own data:
Sales by Distributor
Sales by Product Name
Top 5 Products (donut chart)
Sum of Sales by Customer Name (horizontal bar list)
Latitude and Longitude (a map visual, likely showing customer/distributor locations geographically)
Sales by Channel and Sub-channel
Purpose
This dashboard supports decision-making at every organizational level — executives get a bird's-eye view of overall performance, sales heads can compare managers/reps and track team trends, and individual managers/reps can dig into customer- and distributor-level detail. The consistent red/black CVS-branded design and left-side navigation panel let users move fluidly between these three levels of granularity within the same report.