Customer Support Dashboard
تفاصيل العمل
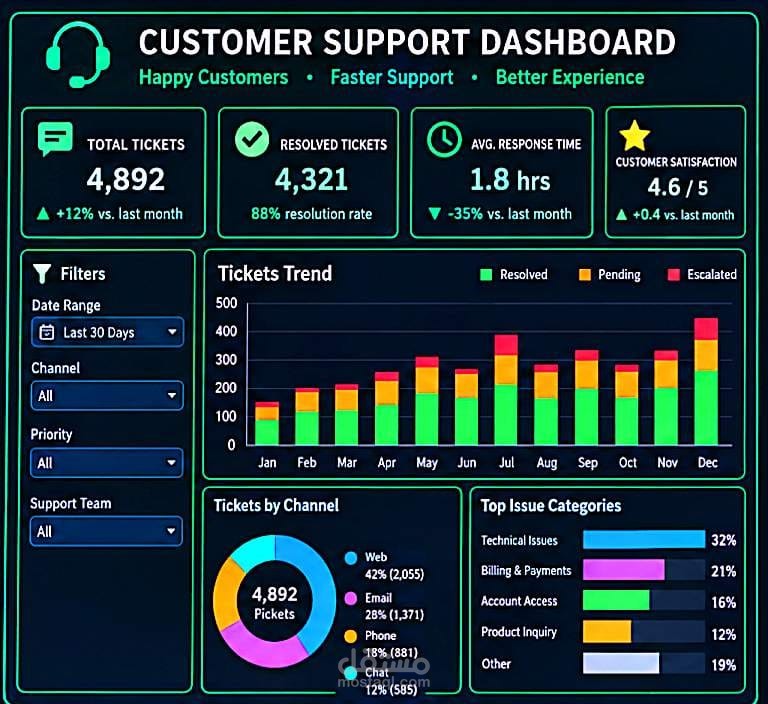
Main sections:
Total Tickets: Shows the total number of customer support tickets.
Resolved Tickets: Displays the number of successfully resolved tickets and the resolution rate.
Average Response Time: Measures how quickly the support team responds to customers.
Customer Satisfaction: Shows the overall customer satisfaction score.
Tickets Trend: Visualizes the monthly ticket volume and ticket status, including resolved, pending, and escalated tickets.
Filters: Allows users to filter data by date range, channel, priority, and support team.
Tickets by Channel: Shows where tickets come from, such as Web, Email, Phone, and Chat.
Top Issue Categories: Highlights the most common customer problems, such as technical issues, billing, account access, and product inquiries.
Purpose:
The dashboard helps managers track project progress, identify risks early, compare departmental performance, and make informed decisions to ensure projects are delivered successfully and on time.