Project Performance Dashboard
تفاصيل العمل
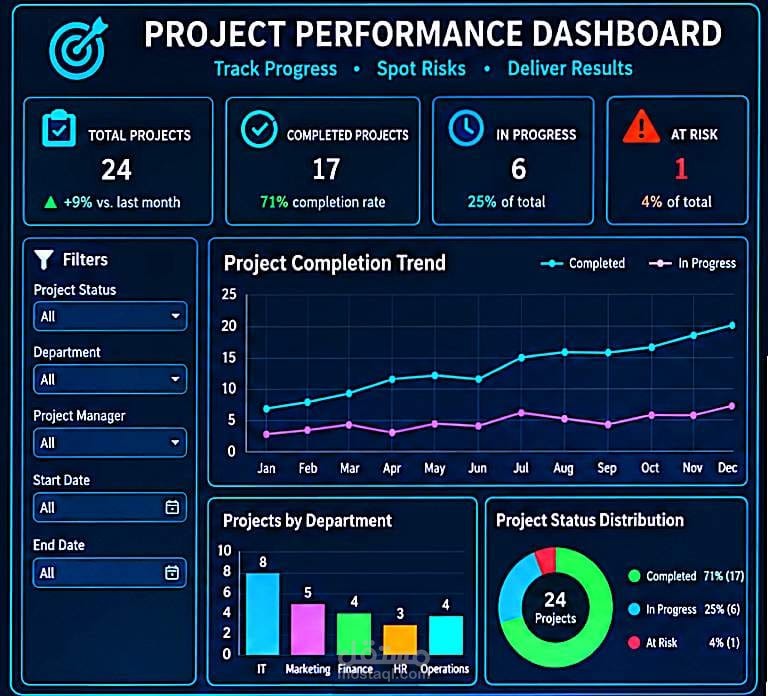
Main sections:
Total Projects: Shows the total number of projects being managed.
Completed Projects: Displays the number of completed projects and the overall completion rate.
In Progress: Shows the projects that are currently ongoing.
Purpose:
The dashboard helps customer support teams monitor performance, identify recurring issues, improve response and resolution times, and enhance the overall customer experience.
At Risk: Highlights projects that may face delays or other potential issues.
Project Completion Trend: Tracks project completion and ongoing projects over time.
Filters: Allows users to filter the data by project status, department, project manager, start date, and end date.
Projects by Department: Compares the number of projects across different departments such as IT, Marketing, Finance, HR, and Operations.
Project Status Distribution: Provides a visual breakdown of completed, in-progress, and at-risk projects.