super store dashboard
تفاصيل العمل
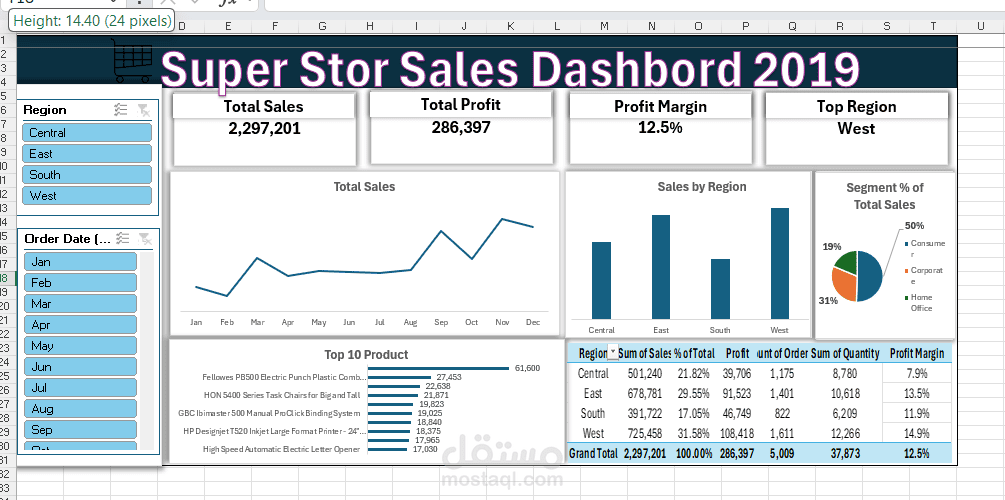
Project Overview
An interactive Microsoft Excel dashboard designed to analyze
overall
revenue, profitability margins, customer segment
distribution, and regional performance.
Key Insights & Highlights
Core Business KPIs: Tracked $2.3M Total Sales and $286.4K
Total Profit, achieving an overall 12.5% Profit Margin across 5,009
orders.
Regional Dominance: Identified the West Region as the top
performer, generating $725.5K (31.6% of total sales) with the
highest regional profit margin at 14.9%.
Customer Segmentation: Analyzed sales distribution across
customer segments, showing Consumer accounts driving 50% of
total revenue, followed by Corporate (31%) and Home Office
(19%).
Product & Trend Analysis: Isolated top-performing products and
analyzed monthly revenue trajectories to track seasonal sales
peaks