Superstore Sales Analytics Dashboard (Power BI)
تفاصيل العمل
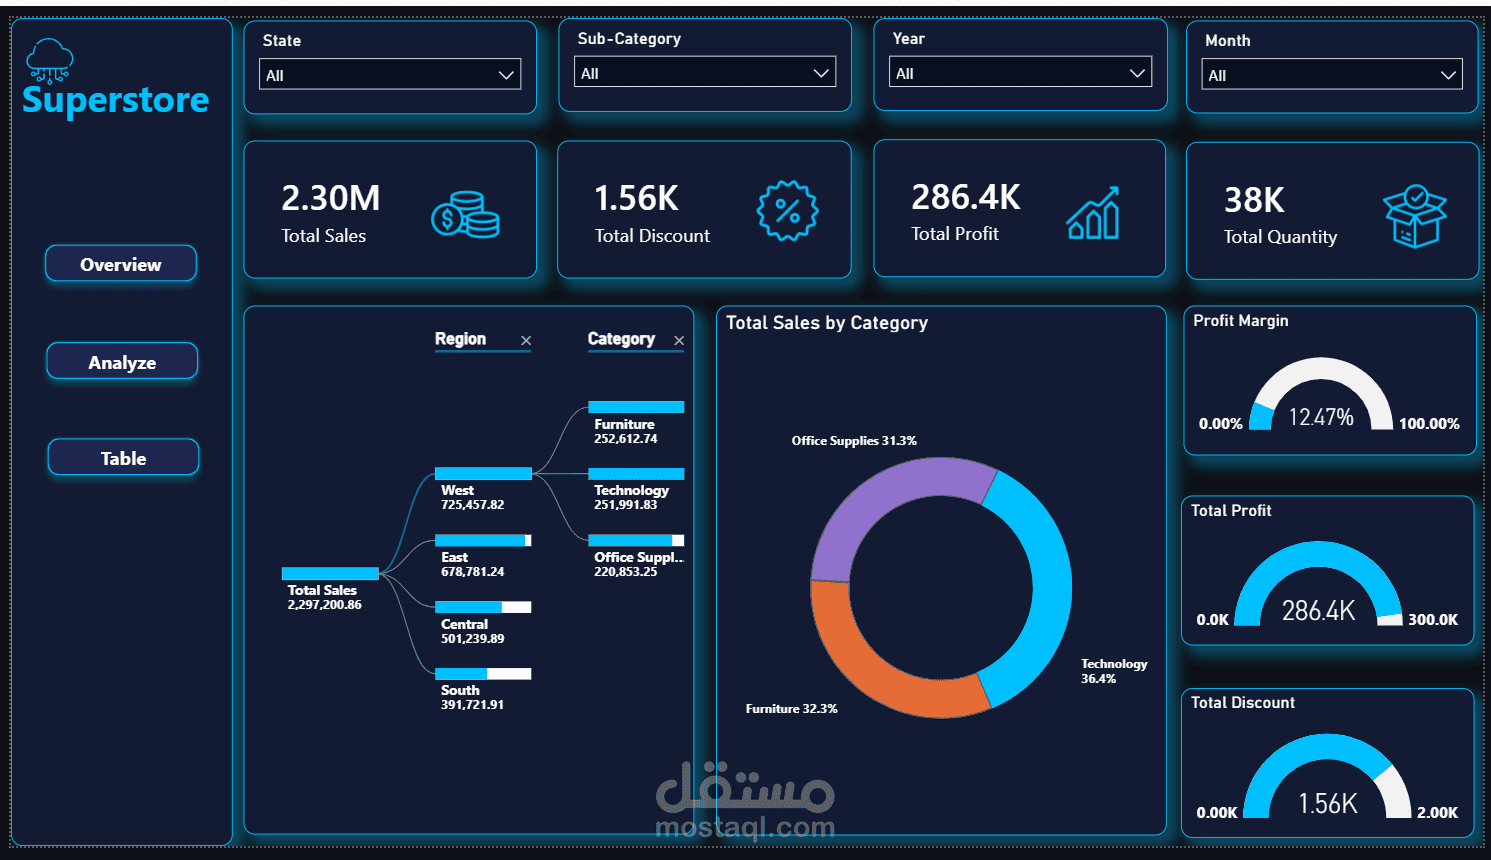
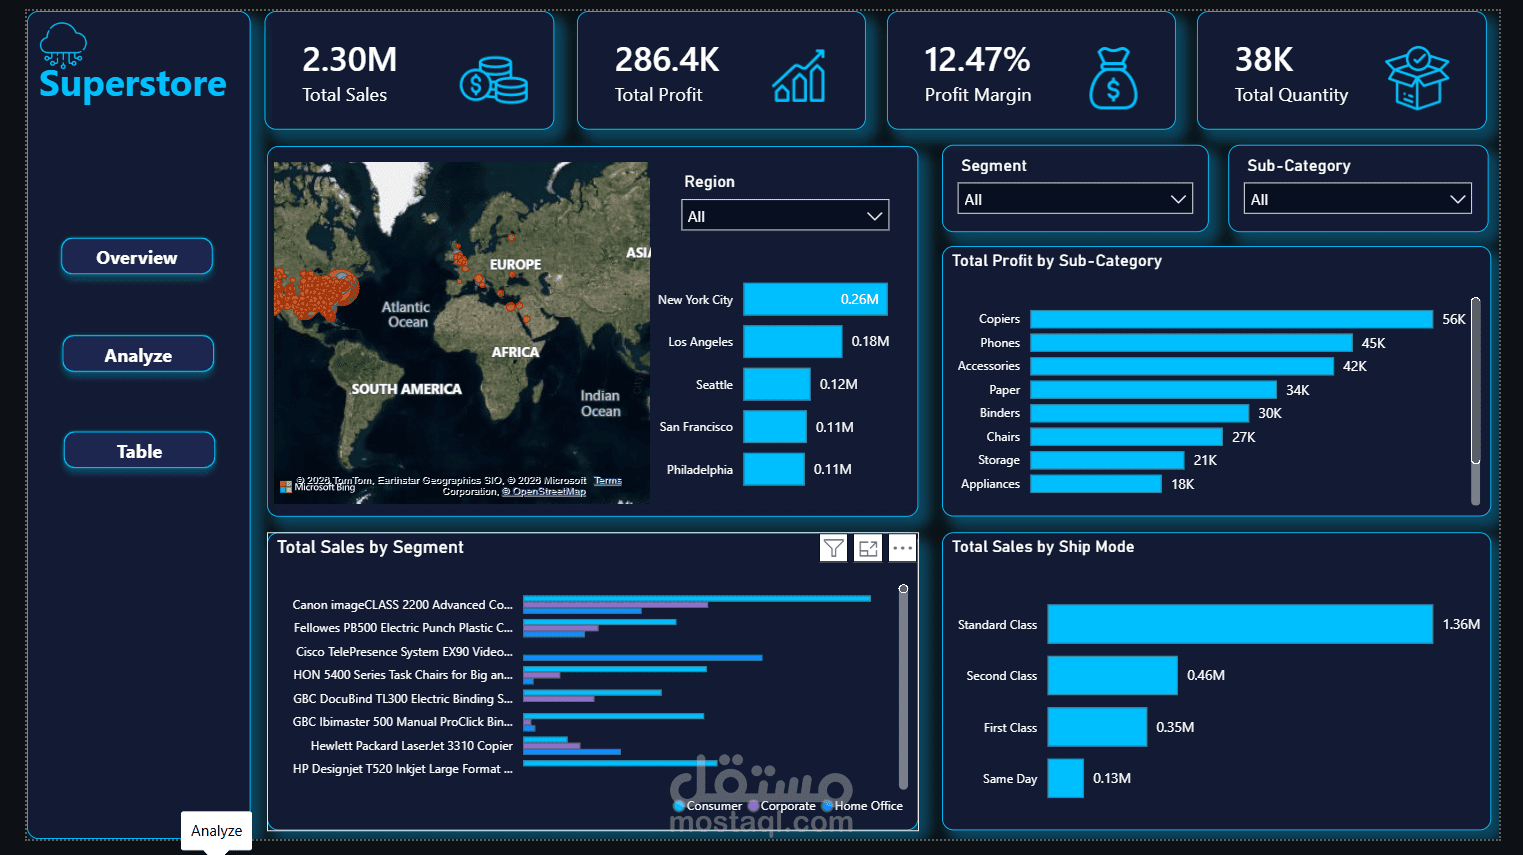
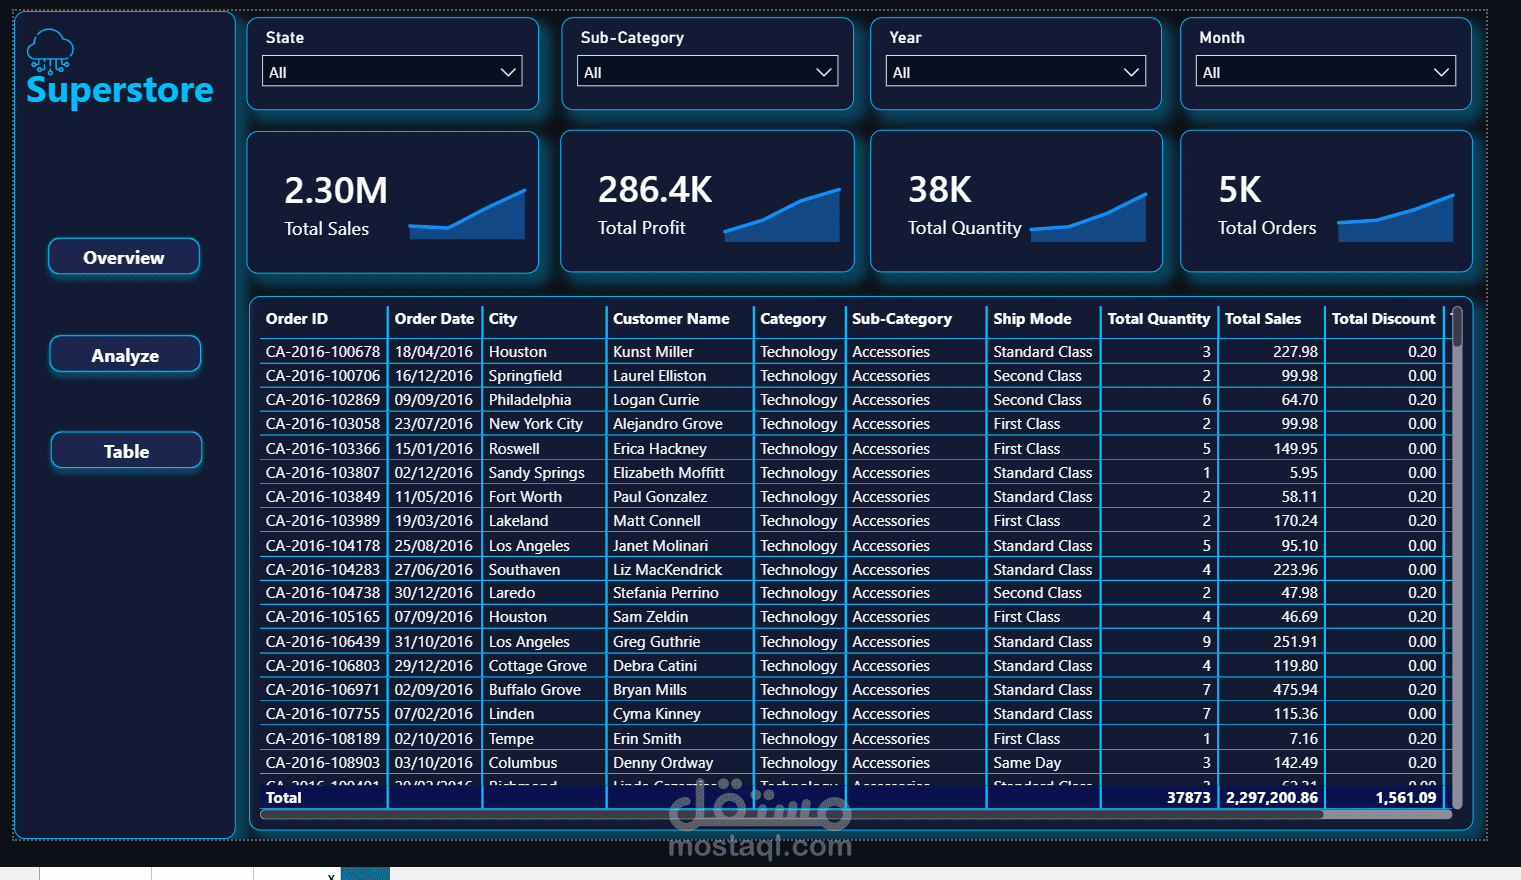
Designed and developed a comprehensive, multi-page interactive Power BI analytics report for a global Superstore dataset, optimizing performance tracking, financial metrics, and sales insights.
Key Dashboard Pages & Features:
* Overview Page: Executive summary displaying core KPIs including Total Sales ($2.30M), Total Profit ($286.4K), Profit Margin (12.47%), Total Quantity, and dynamic slicers for state, sub-category, year, and month.
* Geographic & Category Analysis: Interactive world and regional maps tracking sales performance across locations (e.g., New York, Los Angeles), alongside category profit breakdowns (Furniture, Technology, Office Supplies).
* Segment & Shipping Insights: Detailed analysis tracking sales by customer segments (Consumer, Corporate, Home Office) and shipping modes (Standard Class, Second Class, First Class).
* Detailed Data Table: Integrated clean transactional table view providing granular order-level details (Order ID, Customer Name, Sub-Category, Ship Mode, Quantity, Sales, and Discount).
Tools & Skills Used: Microsoft Power BI, Data Visualization, DAX Measures, Business Intelligence, Data Modeling, Sales Analytics.