Sales Analytics Dashboard (Excel)
تفاصيل العمل
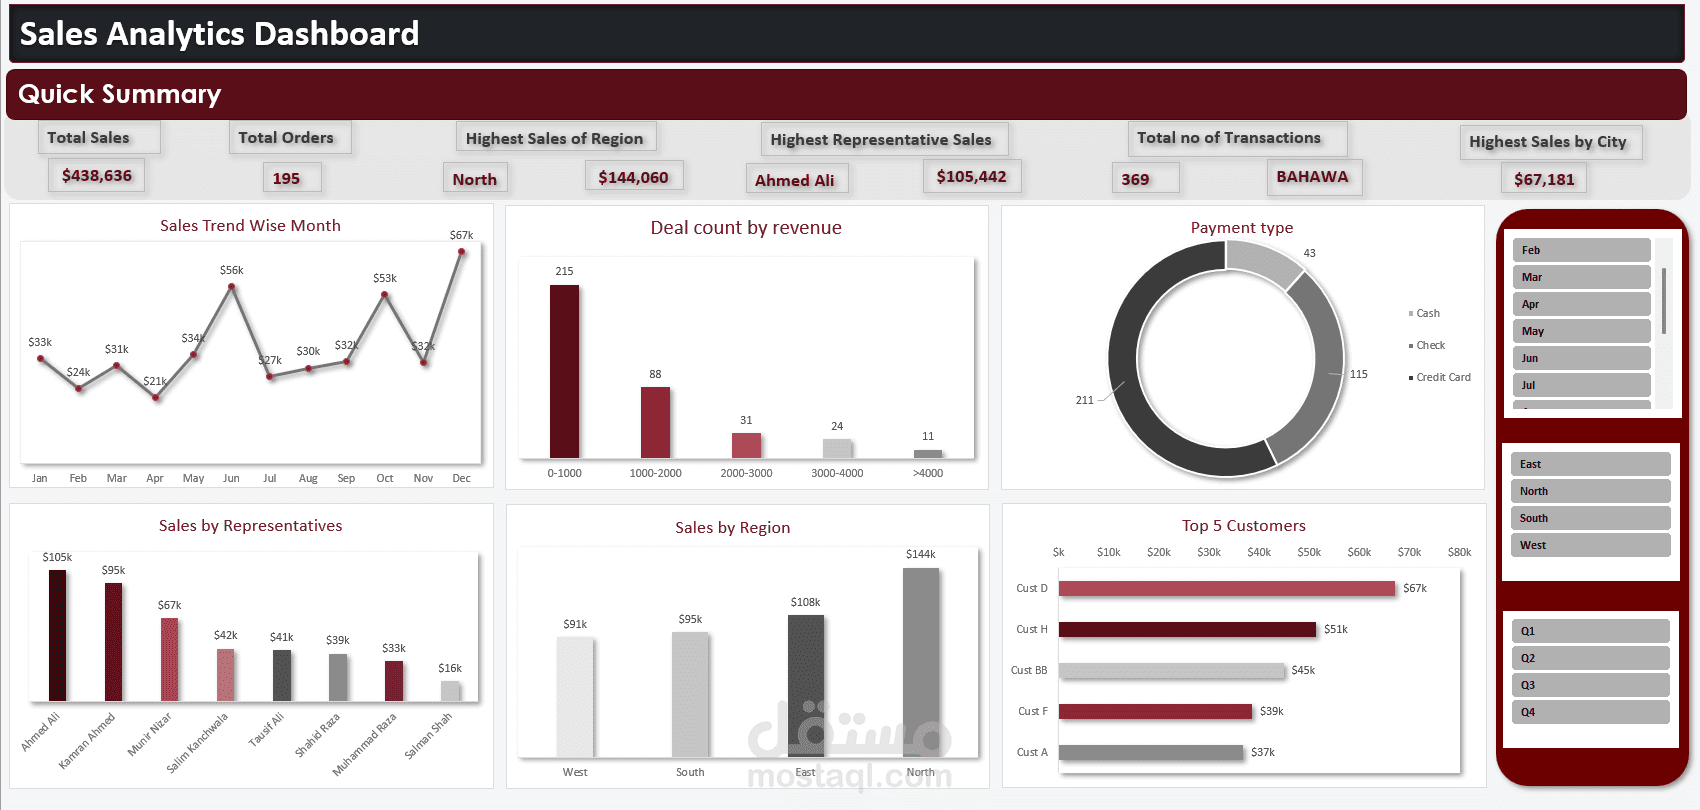
Designed and developed a comprehensive, interactive Sales Analytics Dashboard using advanced Microsoft Excel tools (including PivotTables and Power Query) to track performance, monitor revenue, and analyze sales trends.
Key Dashboard Features & Metrics:
* Quick Summary & KPIs: Executive high-level overview displaying Total Sales ($438K), Total Orders (195), Total Transactions (369), alongside top-performing regions, representatives, and cities.
* Sales Trends & Deals: Tracked monthly sales fluctuations (Sales Trend Wise Month) and deal distributions by revenue ranges.
* Performance Breakdown: Detailed analysis of sales by representatives, regional performance (West, South, East, North), and payment types.
* Top 5 Customers: Visual ranking identifying top-tier clients to highlight key revenue drivers and customer value.
Tools & Skills Used: Microsoft Excel (PivotTables, Power Query), Data Visualization, Business Intelligence, Sales Analytics.