superstone e-commerce
تفاصيل العمل
Executive Sales & Profitability Analysis (Superstore E-Commerce)
Executive Summary
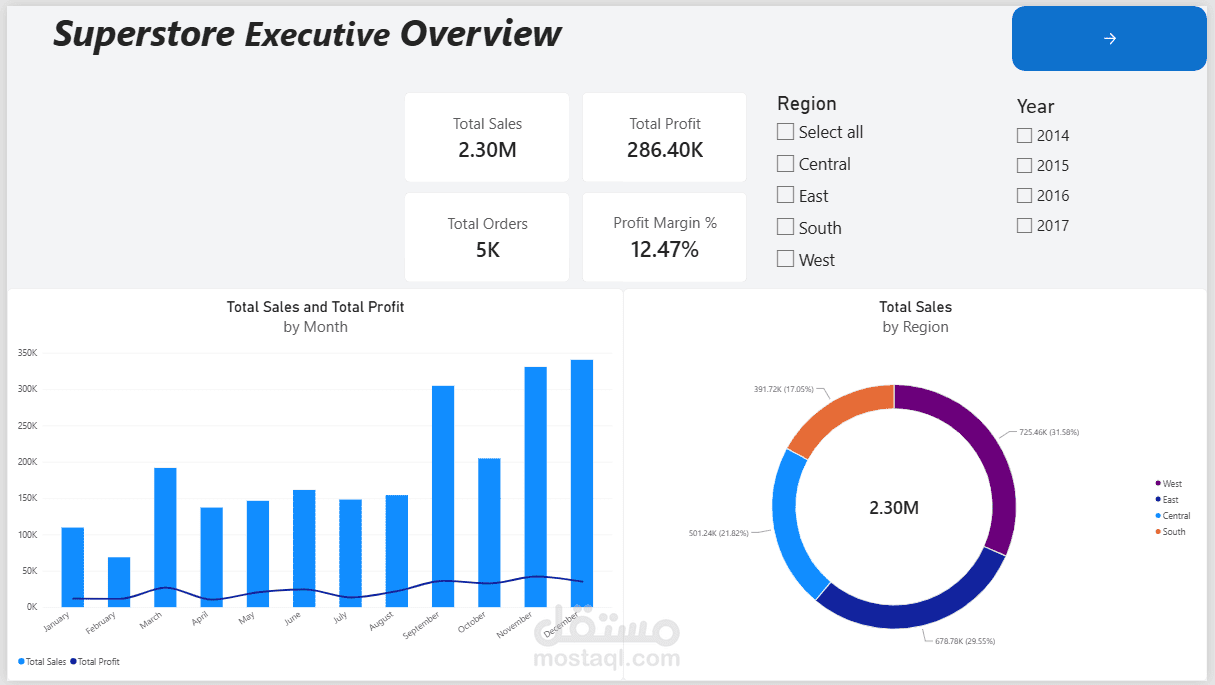
This project delivers an end-to-end business intelligence solution analyzing $2.30M in revenue and $286.40K in net profit across 5,009 unique orders for a multi-regional e-commerce retailer.
The analytical suite includes an interactive Microsoft Excel dashboard for quick financial calculations and a multi-page Power BI report modeled around a Star Schema structure. The goal is to evaluate regional performance, identify peak revenue seasonality, and diagnose the primary drivers of profit margin erosion.
Tools & Technical Architecture
Microsoft Excel: Data cleaning, custom Pivot Tables, parameter-driven slicers, dynamic KPI cards, and custom chart formatting.
Power BI Desktop: Multi-page dashboard layout, canvas hierarchy, drop-shadow visual cards, and drill-through navigation.
Power Query (M): Data transformation, custom date dimension table creation (Dim_Date), and data typing.
Data Modeling: Star Schema design (1-to-Many single-direction relationship between Dim_Date and Fact_Sales).
DAX Calculations: Custom measures for aggregate totals, ratios, conditional metrics, and dynamic time-intelligence (YoY Sales Growth %, Sales PY, Profit Margin %).
Key Business Insights & Findings
Revenue vs. Profit Leaders:
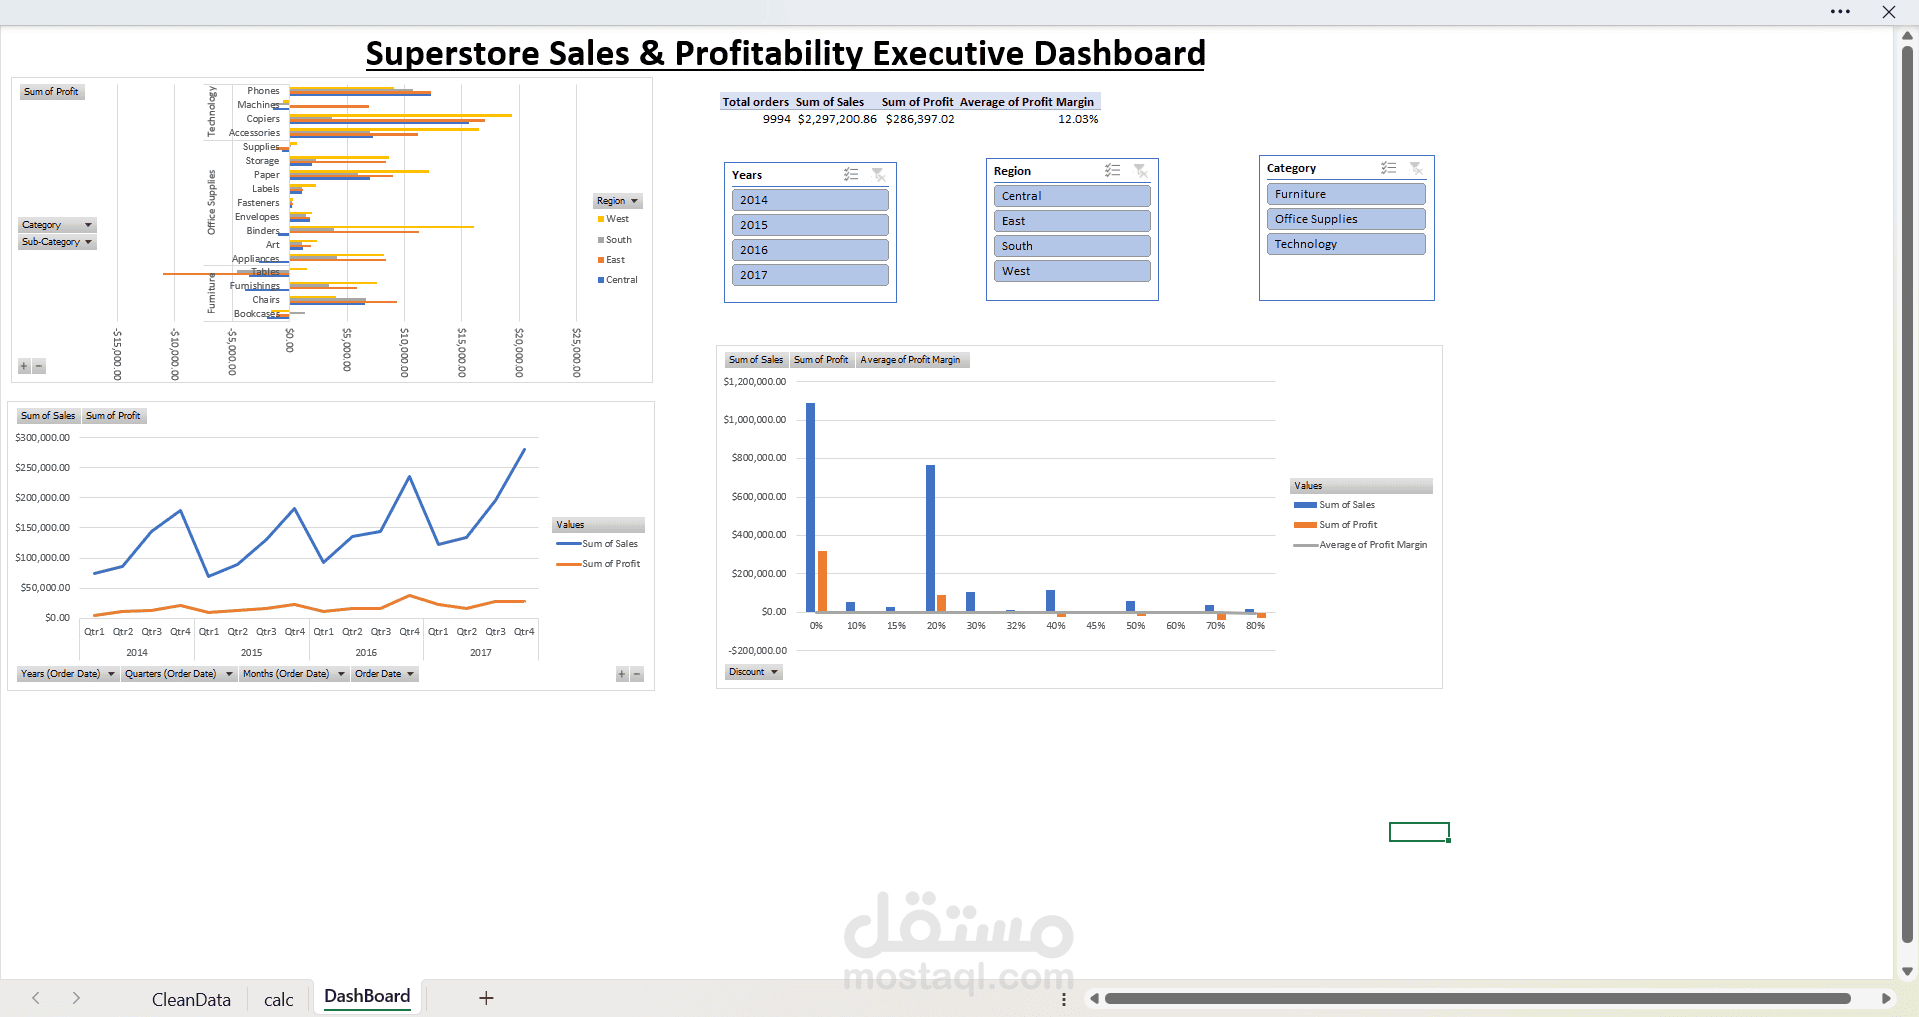
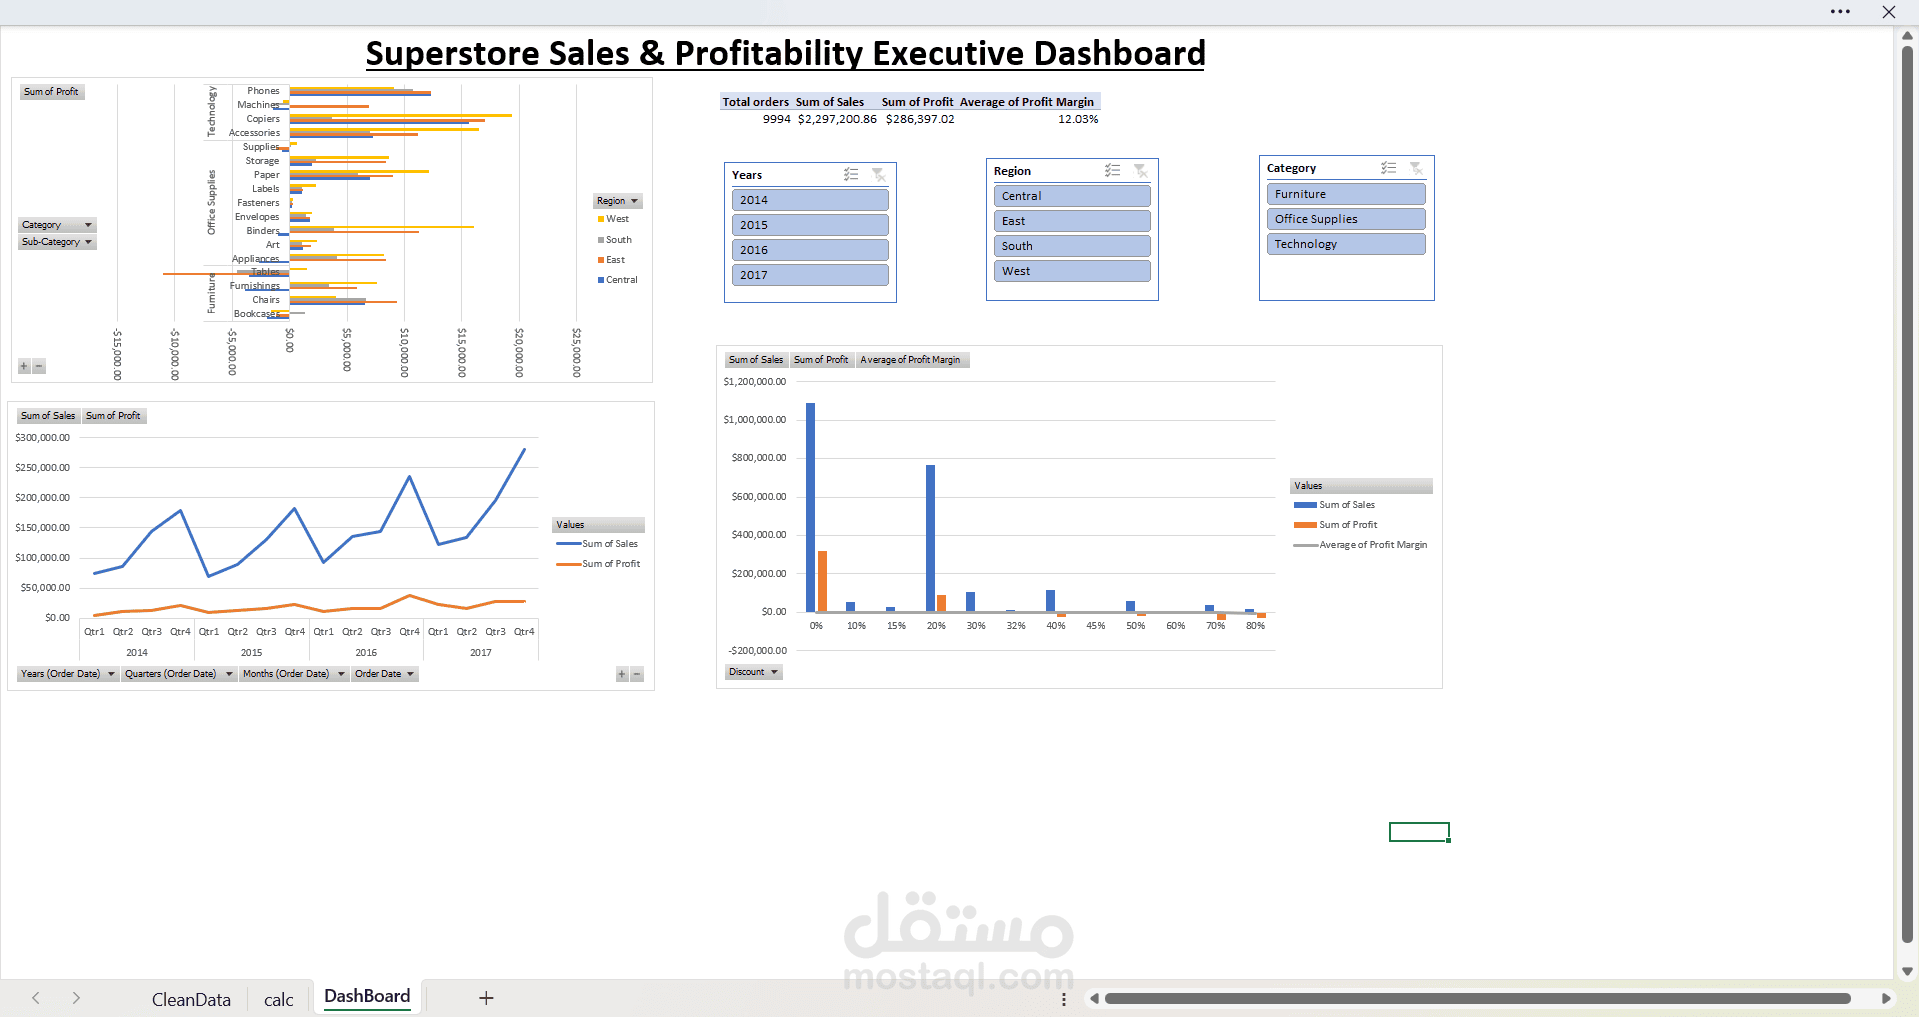
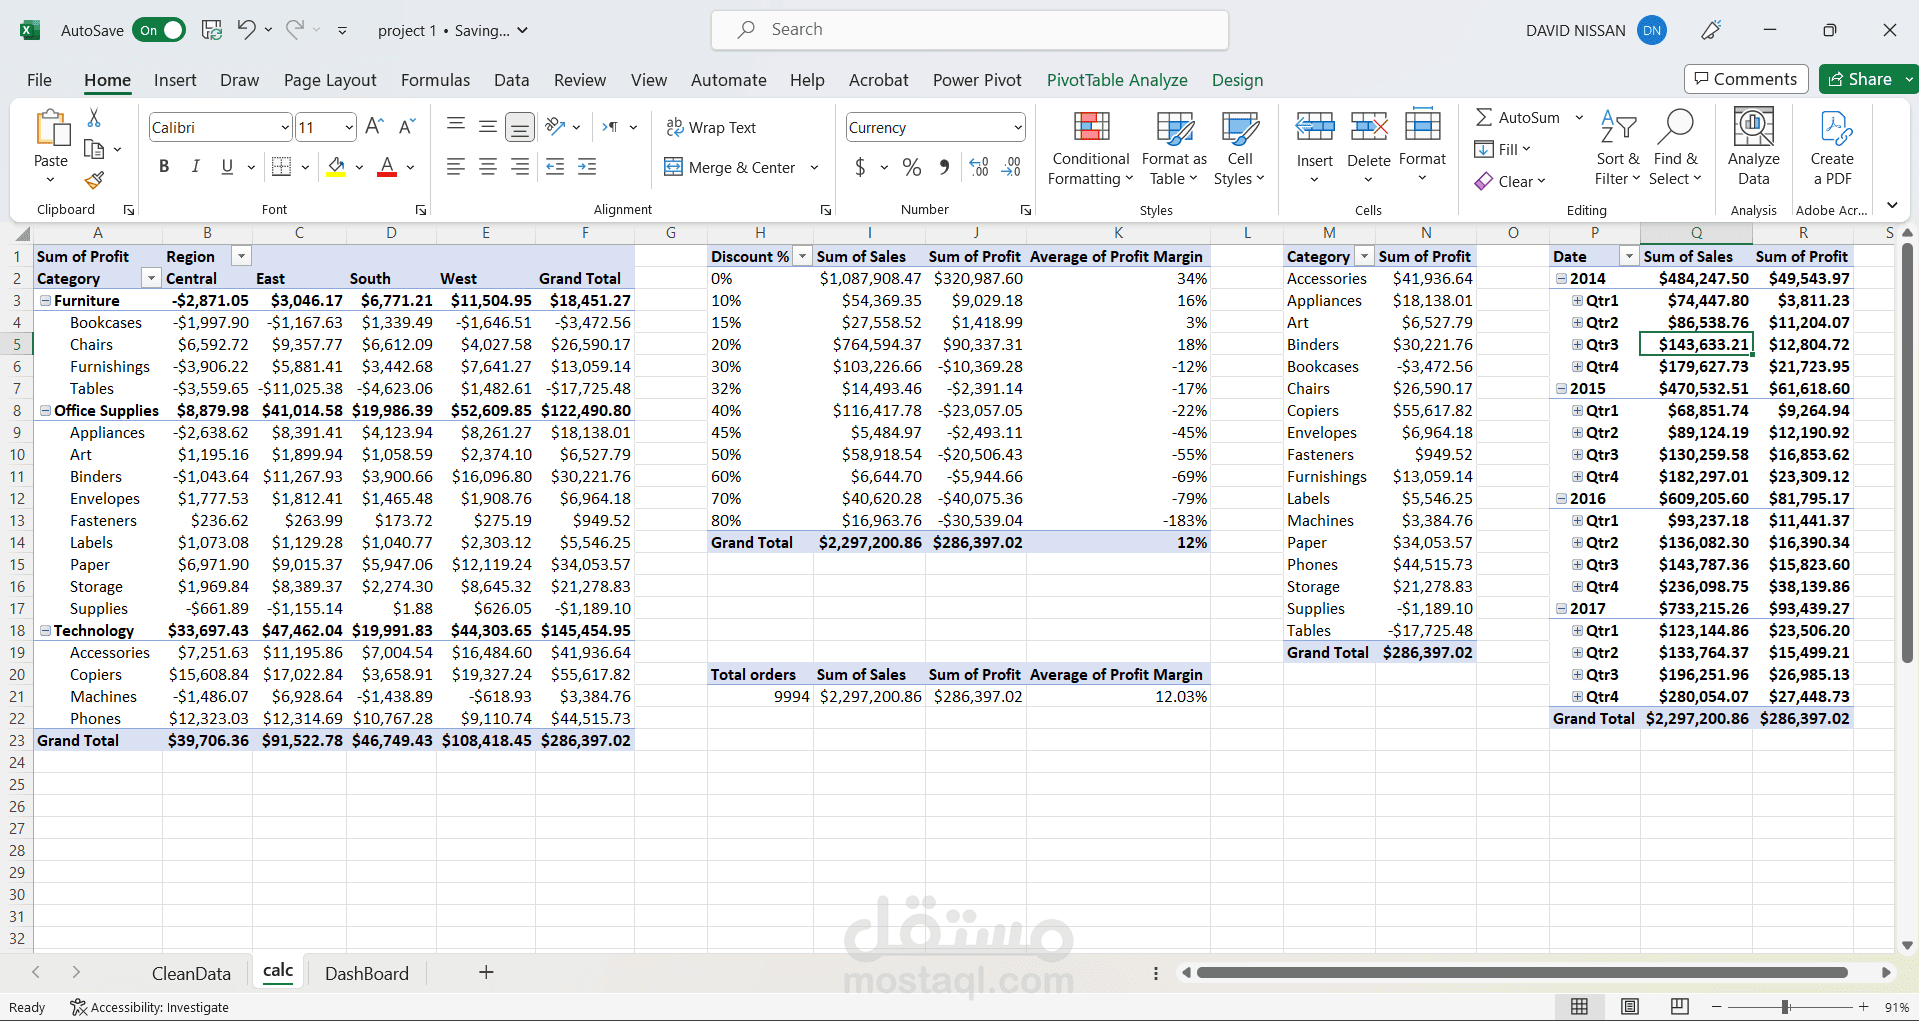
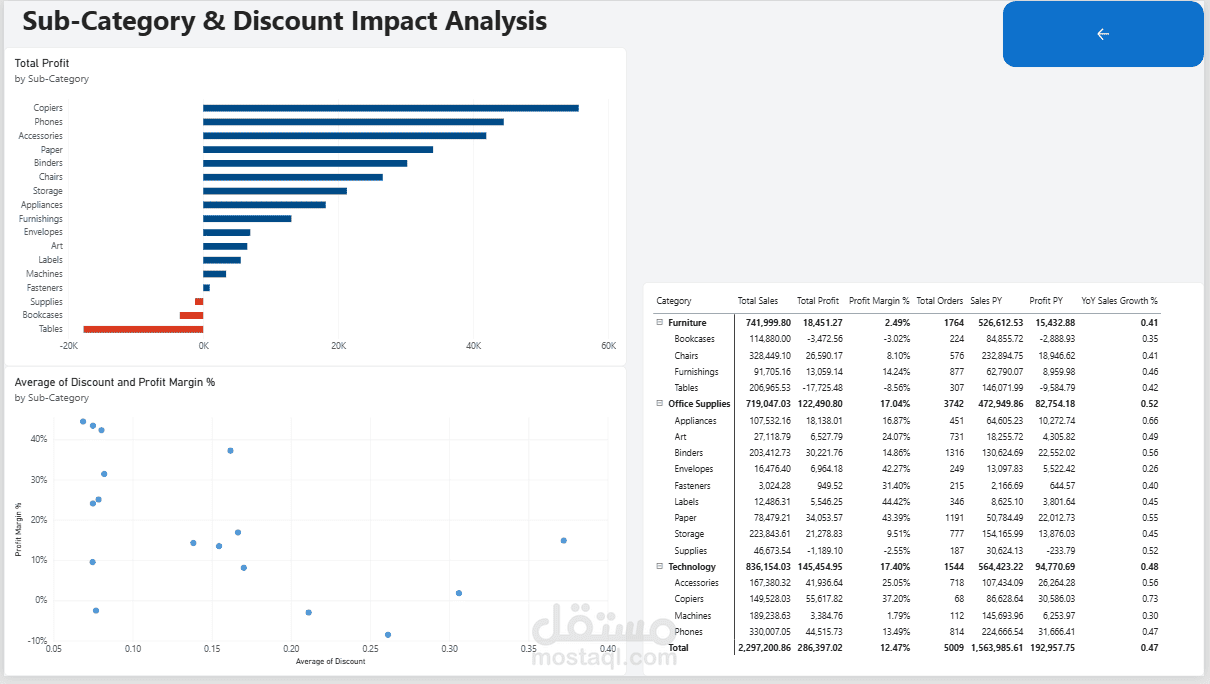
Technology serves as the primary profit engine, generating $145.45K in net profit, led by Copiers ($55.62K) and Phones ($44.52K).
The West Region dominates overall profitability at $108.42K (31.58% of total revenue), followed by the East Region at $91.52K.
The Discount Trap (Profit Margin Erosion):
Aggressive discounting policies directly undermine operating margins. Average discounts exceeding 20% push profit margins into negative territory.
Tables suffer severe losses, recording a net loss of -$17,725.48 (-8.56% profit margin) due to excessive discount rates reaching up to 80%.
Seasonality Trends:
Monthly trend analysis reveals strong Q4 seasonality, with order volume and sales surging dramatically between September and December.
Key DAX Measures Implemented
Total Sales = SUM(Fact_Sales[Sales])
Total Profit = SUM(Fact_Sales[Profit])
Total Orders = DISTINCTCOUNT(Fact_Sales[Order ID])
Profit Margin % = DIVIDE([Total Profit], [Total Sales], 0)
Sales PY = CALCULATE([Total Sales], SAMEPERIODLASTYEAR(Dim_Date[Date]))
YoY Sales Growth % = DIVIDE([Total Sales] - [Sales PY], [Sales PY], 0)
Strategic Recommendations for Leadership
Discount Capping: Restrict maximum allowable discounts on Furniture (specifically Tables and Bookcases) to 15% to prevent negative-margin orders.
Inventory Allocation: Prioritize Technology product fulfillment in high-margin regions (West and East) ahead of the Q4 peak demand cycle.
Product Bundling: Bundle lower-performing categories with high-margin items (like Copiers or Accessories) rather than relying on direct price reductions.