Super Store Sales Dashboard – Sales & Profit Analysis
تفاصيل العمل
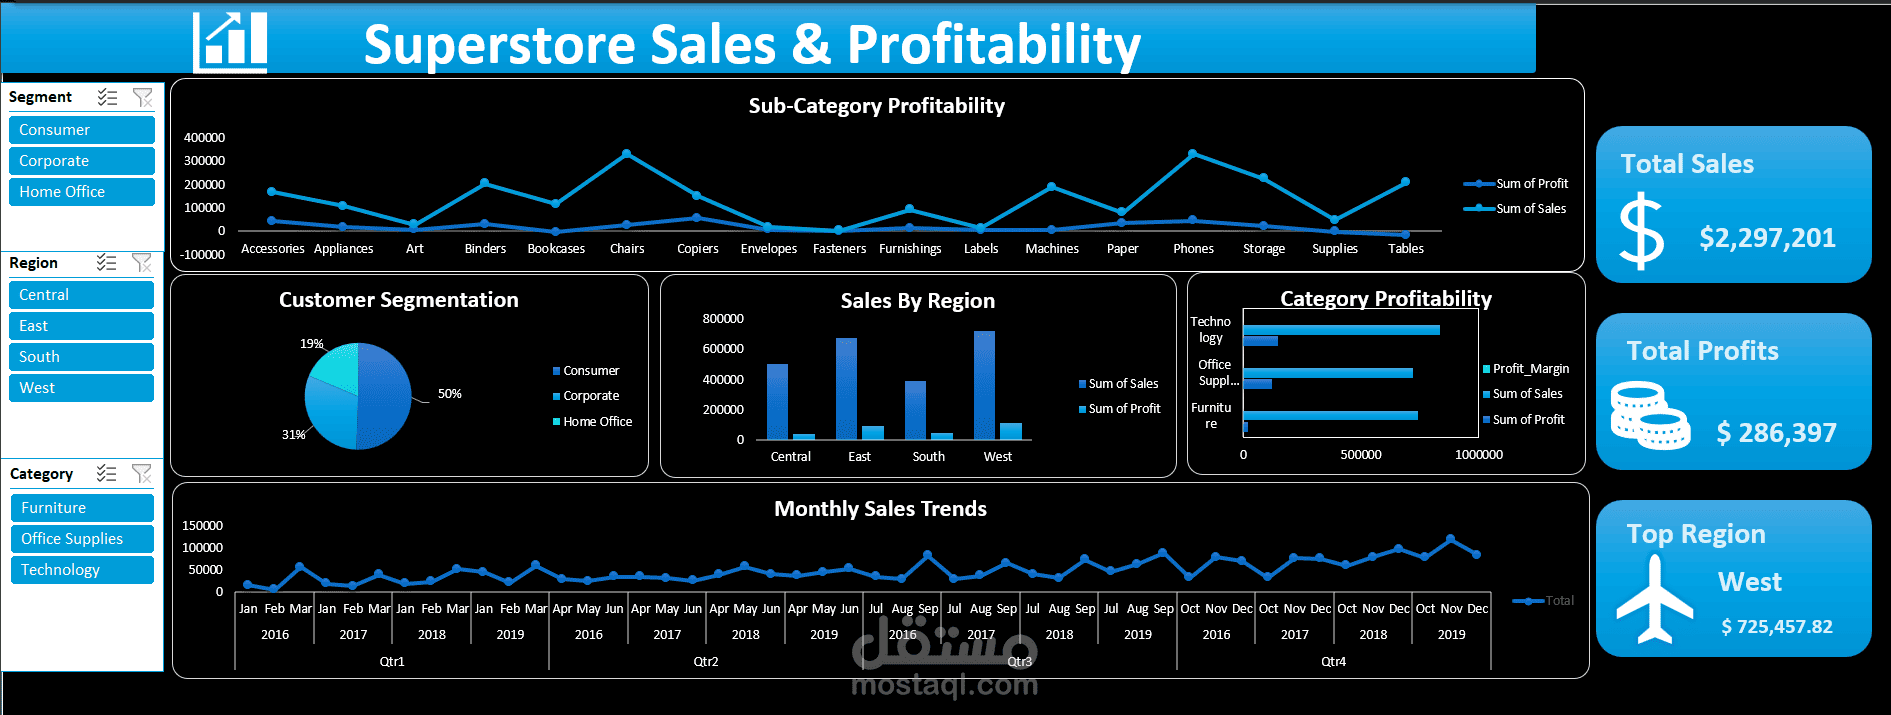
An interactive sales dashboard built using Microsoft Excel to analyze sales performance, profit, products, categories, regions, and customer segments.
The dashboard transforms raw sales data into clear and interactive insights using data cleaning, Power Query, Pivot Tables, Pivot Charts, and data analysis techniques.
The project helps identify sales trends, profitable categories, top-performing products, and key business metrics to support better decision-making.
Tools & Skills: Microsoft Excel, Power Query, Pivot Tables, Pivot Charts, Data Cleaning, Data Analysis, and Dashboard Design.