project 2
تفاصيل العمل
Detailed Required Tasks
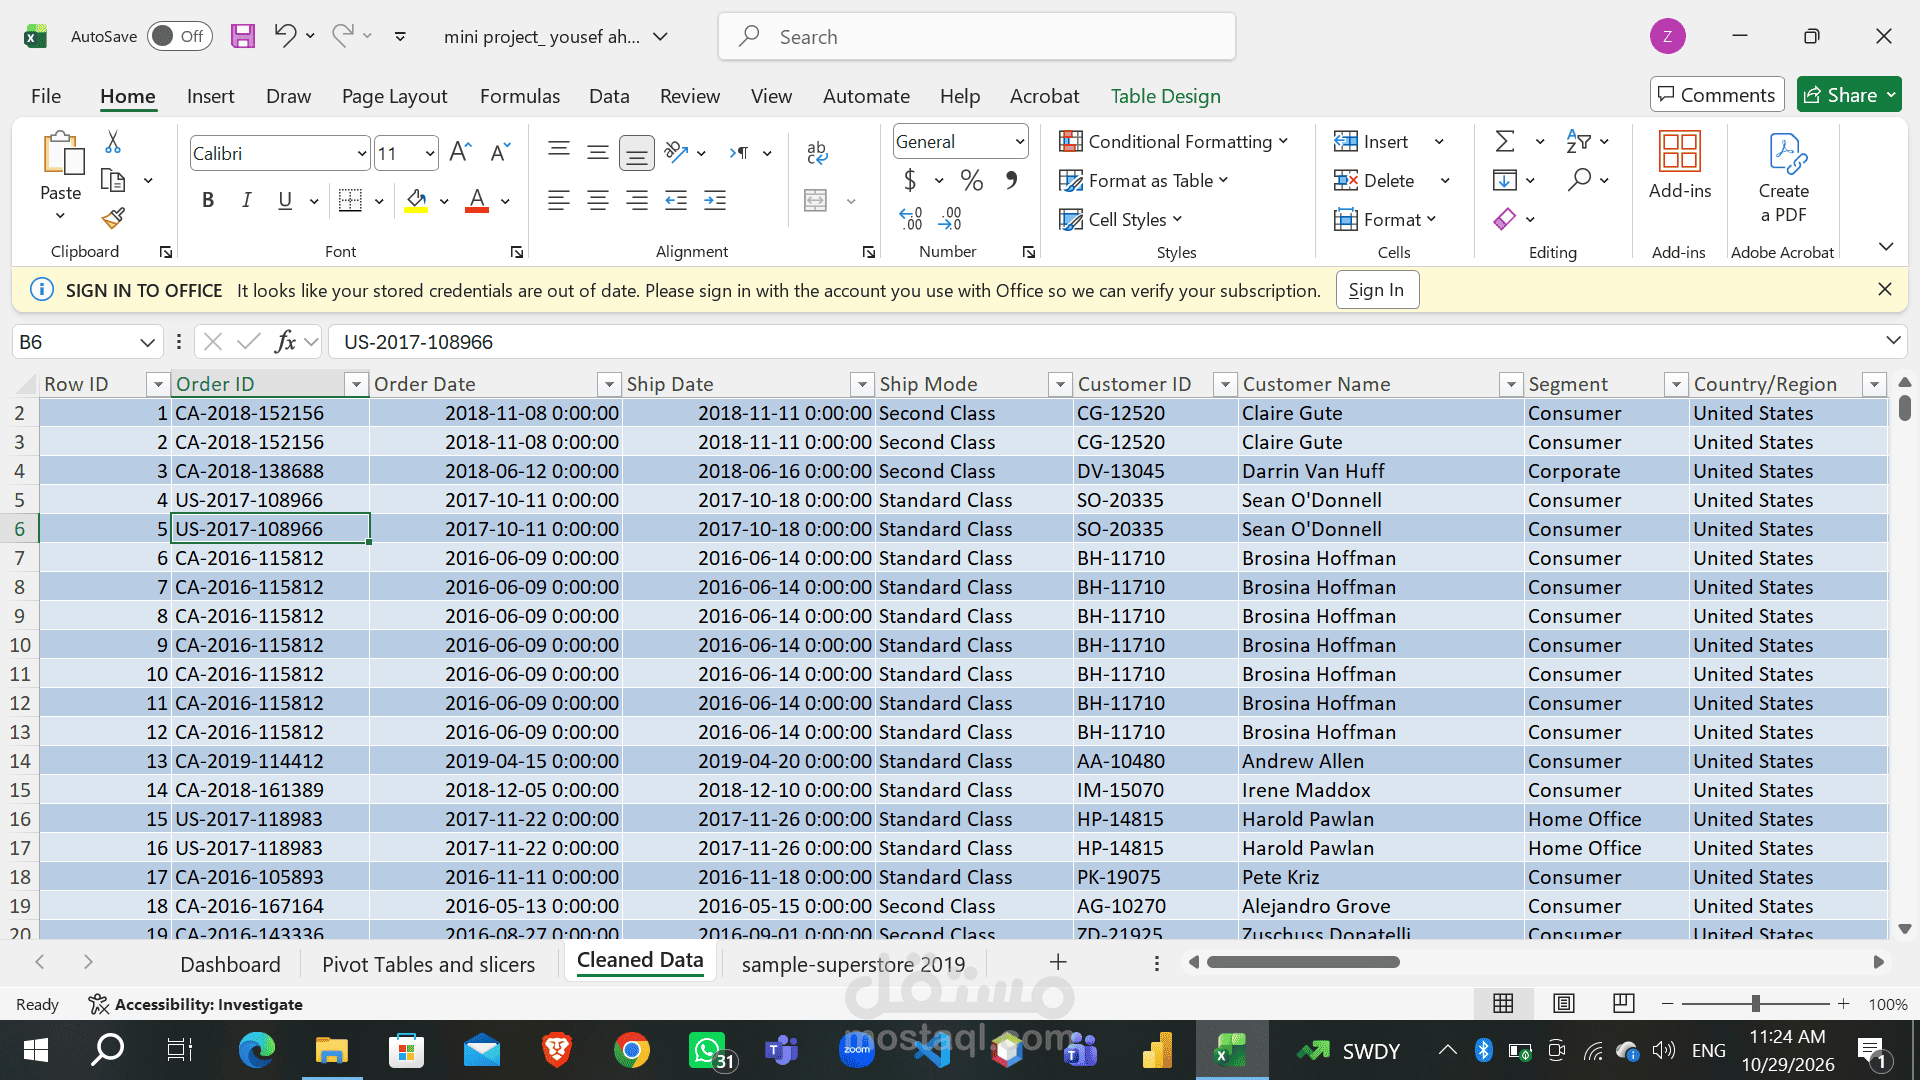
Import the dataset into Excel and inspect data quality issues.
Use Power Query to clean the dataset: remove duplicates, handle missing values, standardize category names, and correct data types.
Create calculated columns such as Profit Margin and Sales Category.
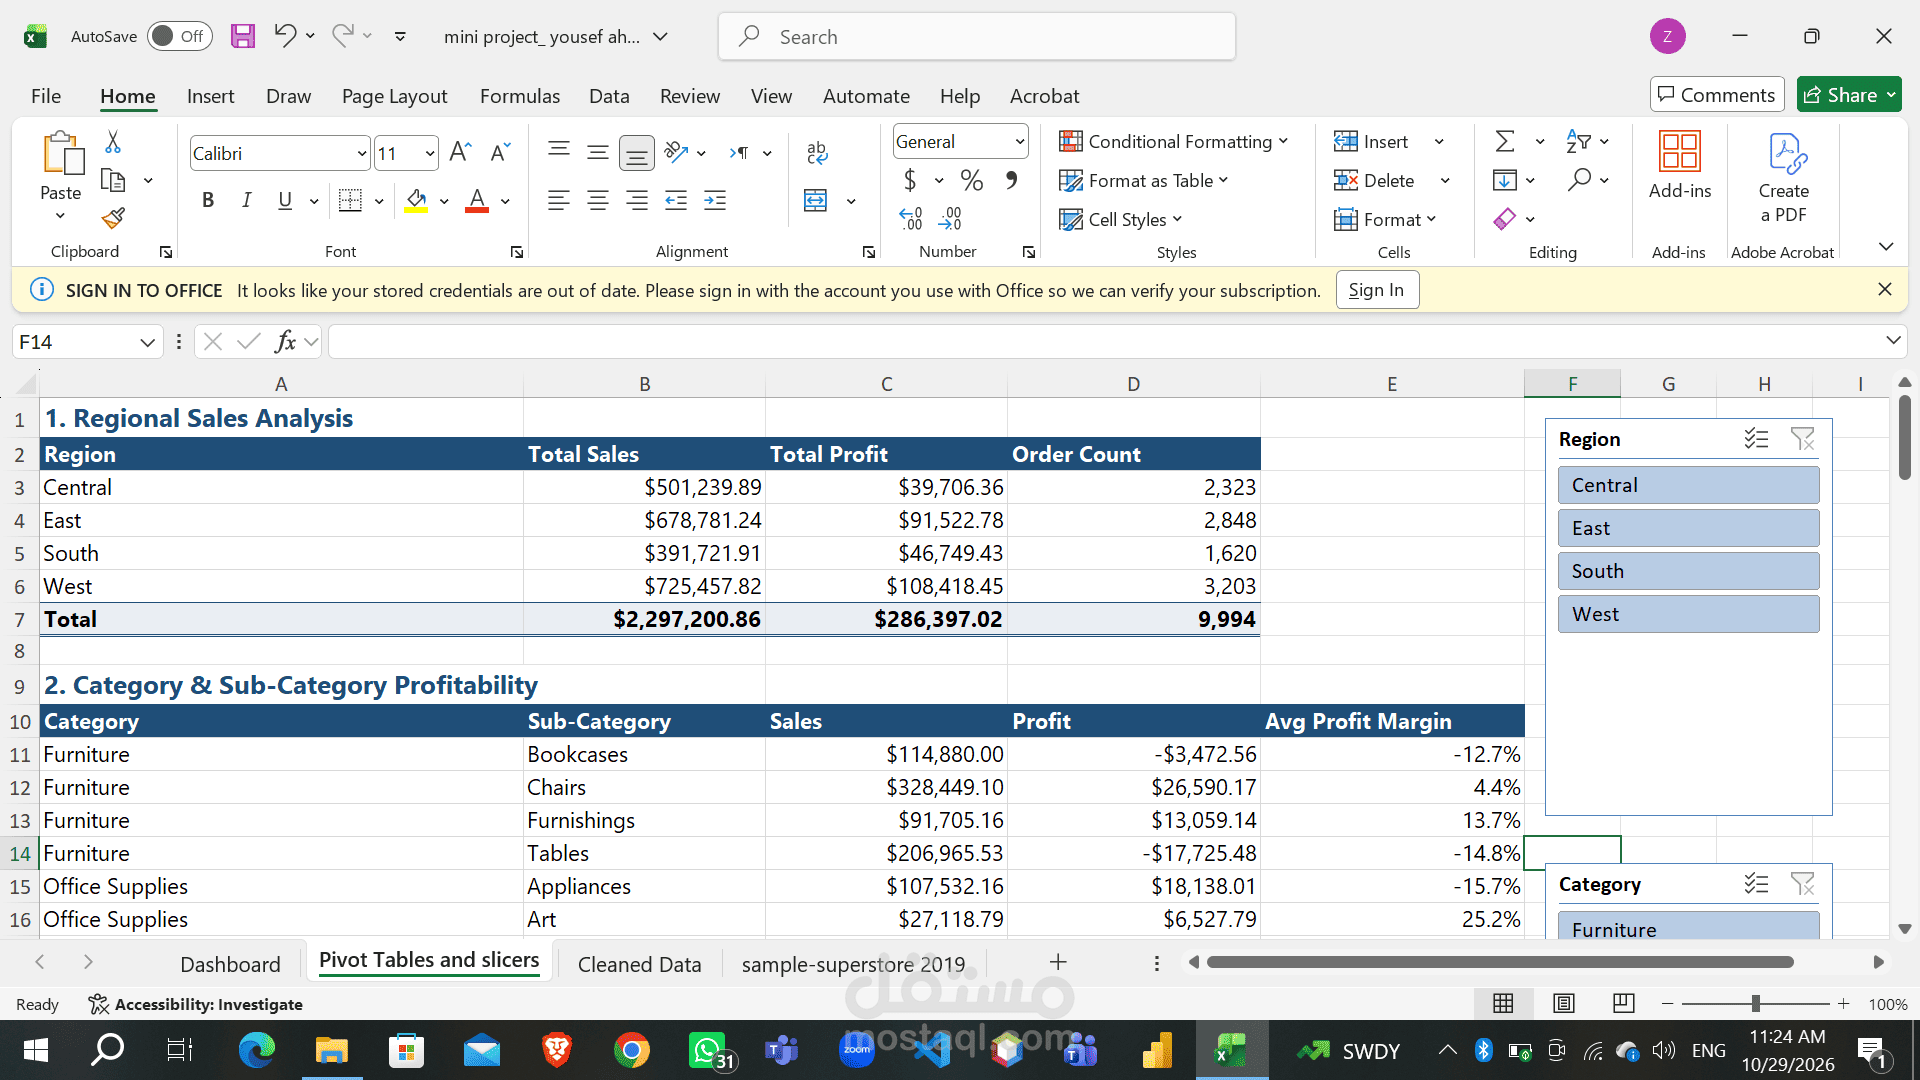
Build Pivot Tables for regional sales analysis, category profitability, customer segmentation, and monthly trends.
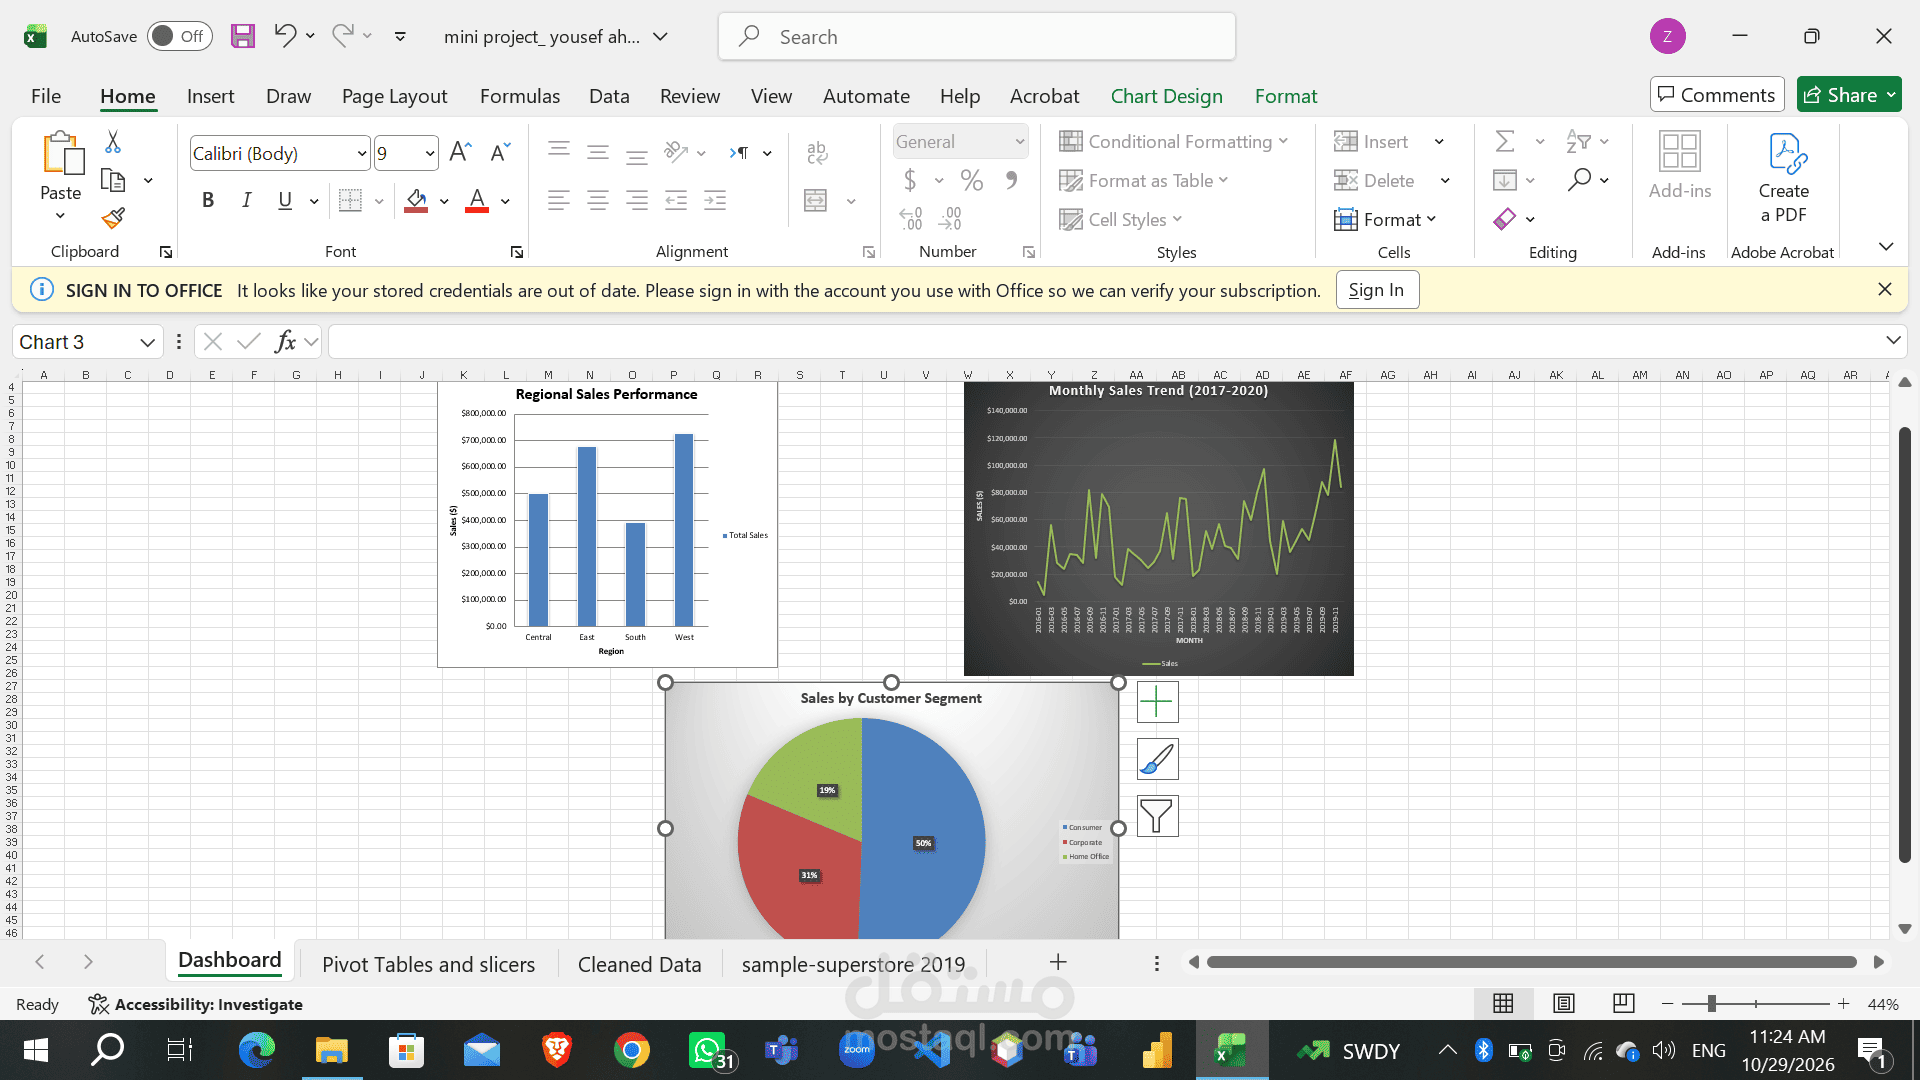
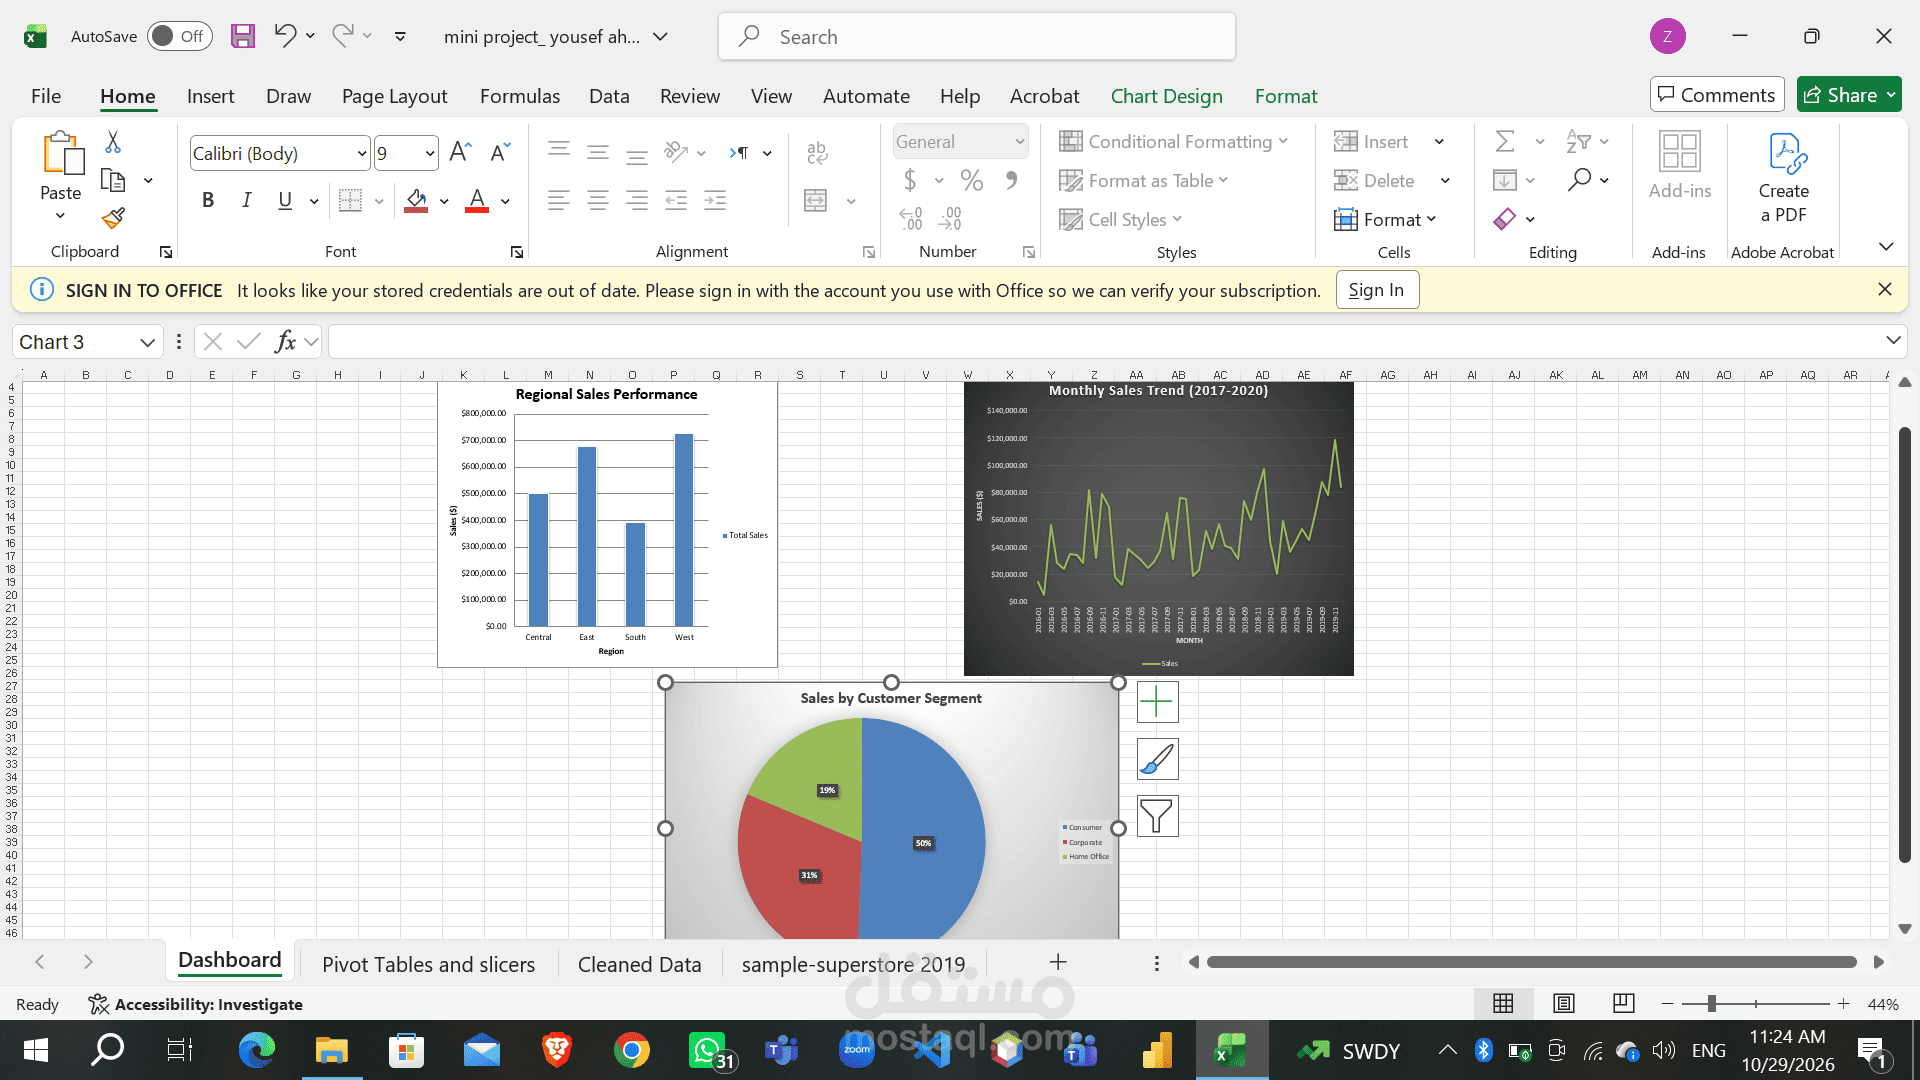
Create Pivot Charts including line charts, column charts, and pie charts.
Add slicers for Region, Segment, and Category.
Design a one-page interactive management dashboard.
Technical Requirements
Minimum 5 Pivot Tables.
Minimum 3 Pivot Charts
At least 2 slicers.
Dashboard must include KPI cards for Total Sales, Total Profit, and Top Region