Employee Records Analytics — Interactive Excel Dashboard
تفاصيل العمل
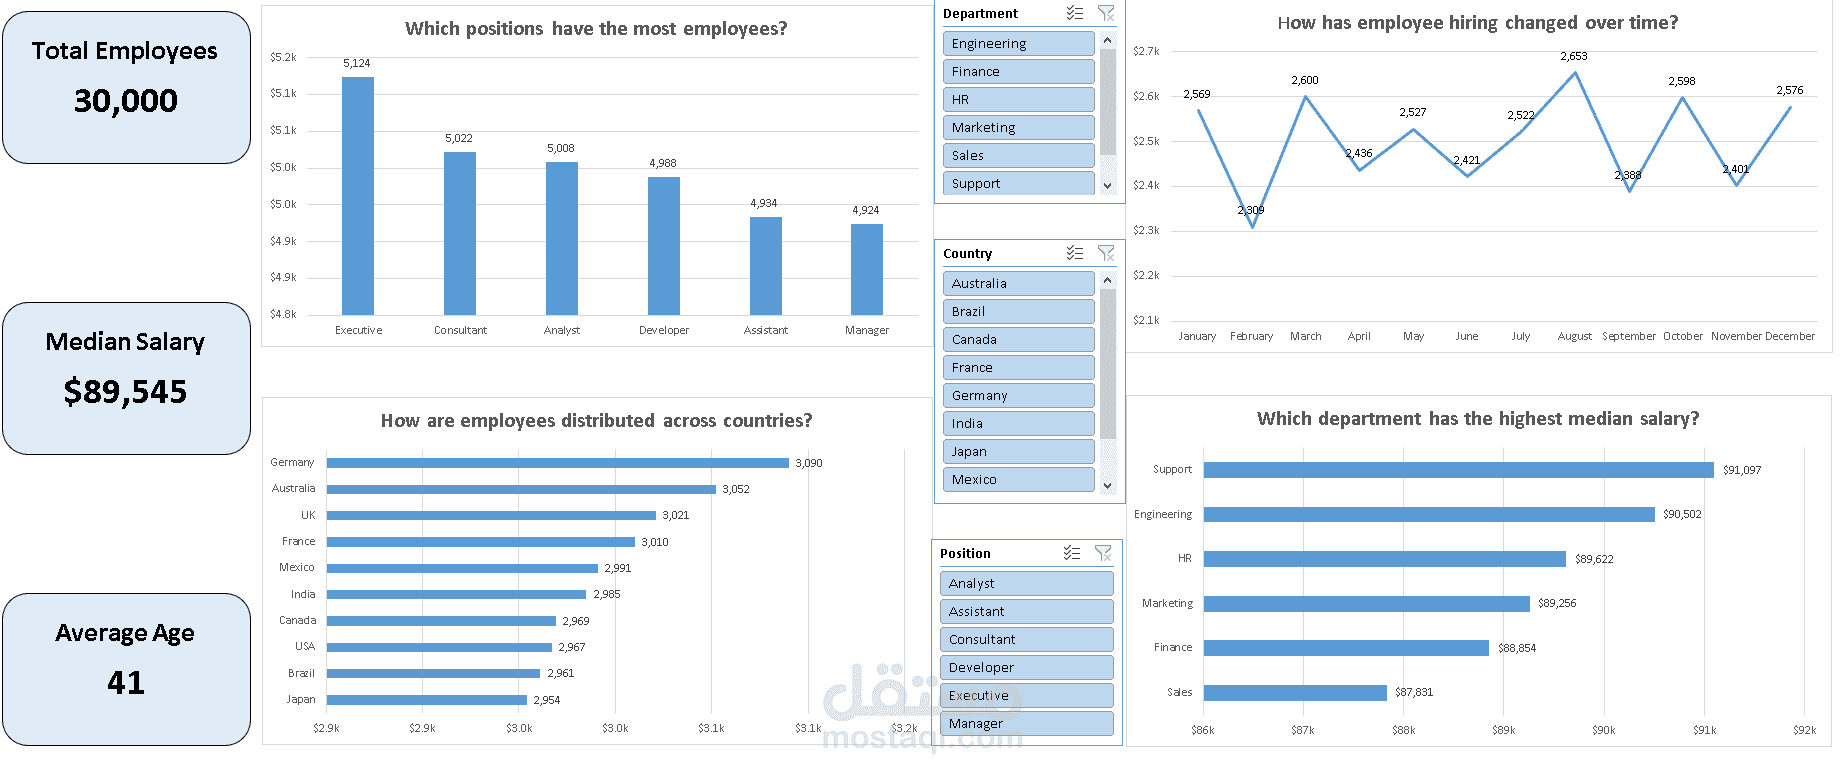
This project analyzes 30,000 employee records from a company operating across 10 countries and 6 departments, with hiring dates spanning 2015 to 2025. The goal is to turn a large, flat HR dataset into an interactive dashboard that answers the kind of workforce questions an HR manager or executive would actually care about — headcount, compensation, and hiring trends across the organization.
:Objectives
Handle a large-scale dataset (30K rows) cleanly and efficiently in Excel
Build a proper data model in Power Pivot rather than relying on flat-table formulas
Write reusable DAX measures to summarize workforce data dynamically
Answer real HR business questions using data, not assumptions
Package everything into a single-screen, filterable dashboard
: Tools & Skills Used
Excel — core platform
Power Query — data extraction, cleaning, and transformation
Power Pivot — data modeling and relationships
DAX — calculated measures for dynamic, filter-aware summaries
PivotTables / PivotCharts — analysis and visualization
Dashboard design — layout, KPI cards, slicers, visual hierarchy
Like the projects before it, this one follows a complete, professional analytics pipeline — not just a single chart thrown together:
📥 Raw Dataset → 🔍 Inspect → 🧹 Power Query → 🧼 Data Cleaning → 🗄️ Data Model
→ 🧮 DAX Measures → ❓ Business Questions
→ 📊 PivotTables/Charts → 🖥️ Interactive Dashboard