SuperMarket Sales Analysis — Interactive Excel Dashboard
تفاصيل العمل
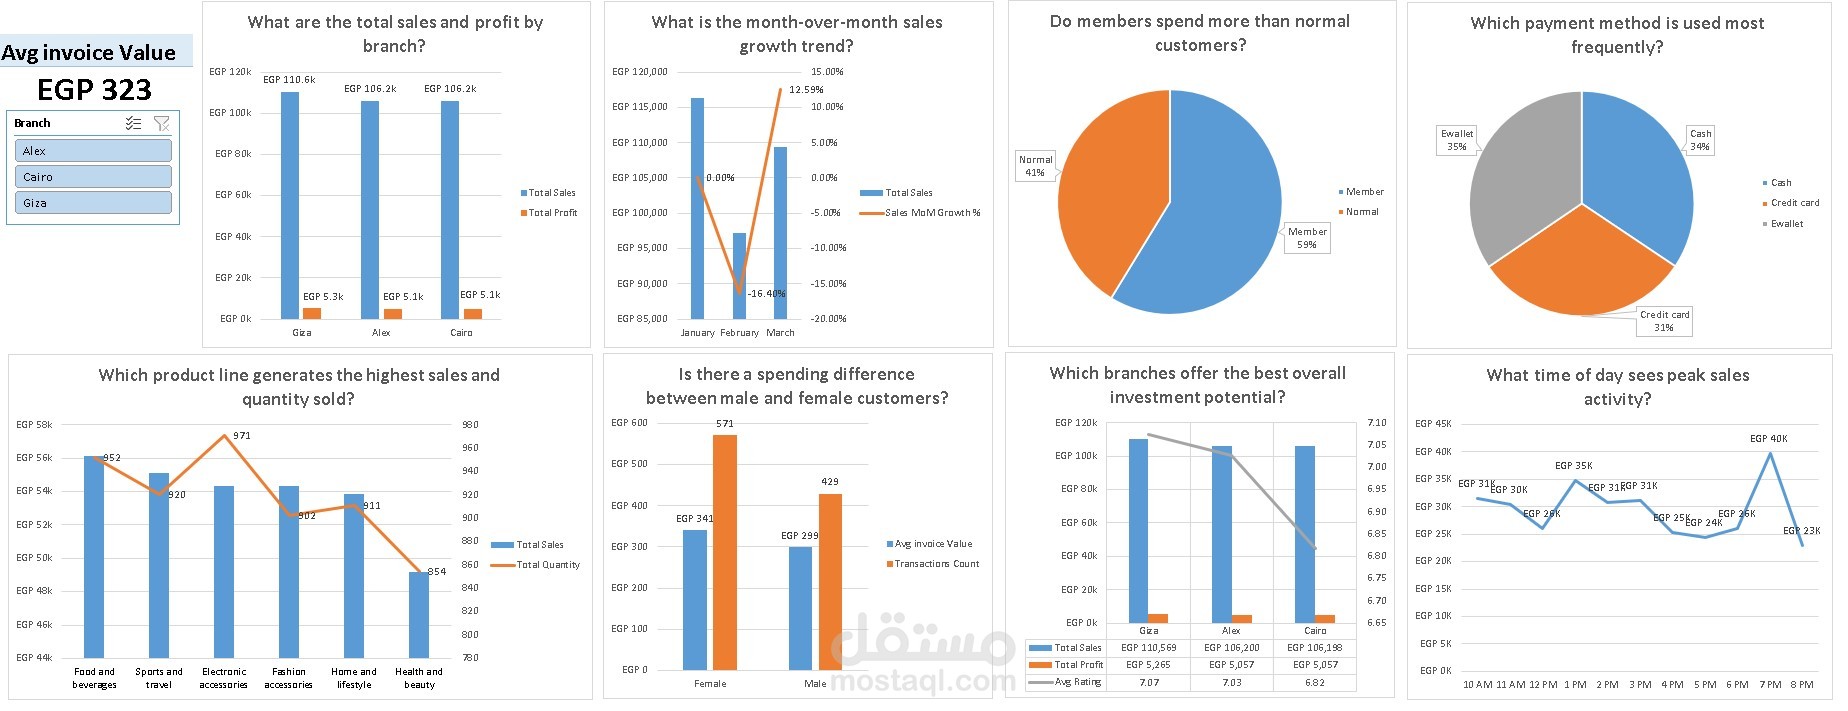
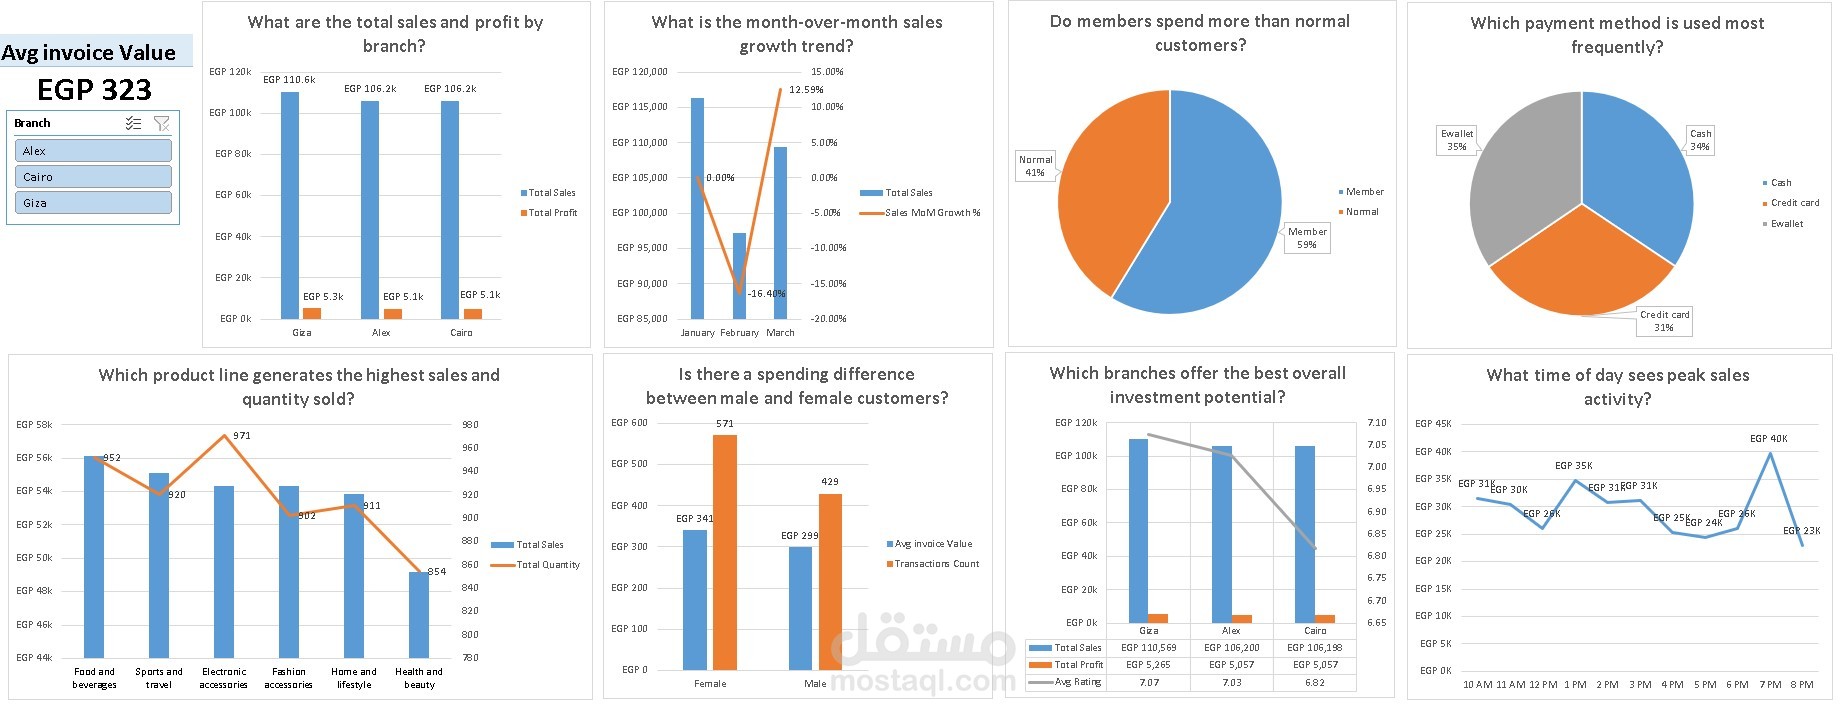
This project analyzes 1,000 sales transactions from a supermarket chain operating across three branches (Alexandria, Cairo, and Giza) between January and March 2019. The goal is to transform raw, messy transactional data into a fully interactive dashboard that answers real business questions — the kind a manager or investor would actually ask.
🎯 Objectives
Practice a real-world BI workflow end-to-end, not just isolated Excel formulas
Turn a flat spreadsheet into a relational data model with proper relationships
Write reusable, dynamic DAX measures instead of static formulas
Answer 10 concrete business questions using data, not assumptions
Package everything into a single-screen, filterable dashboard
Data Cleaning (Power Query)
Real datasets are never perfect — here's what was actually fixed:
Verified no missing values and no duplicate transactions (1,000 unique Invoice IDs)
✅ Resolved a Branch/City mismatch in the source data (branch names didn't match their listed cities)
✅ Corrected the Time column's data type (was stored as plain decimal, not recognized as a proper time value)
✅ Removed a redundant "gross margin percentage" column — it was mathematically constant across every single row, so it added no analytical value
✅ Standardized text fields (trimmed whitespace, cleaned formatting)
🗄️ Data Model
Built a proper star schema in Power Pivot:
Fact Table
Dimension Table
Relationship: One-to-many
🧮 DAX Measures
❓ Business Questions Answered
💰 What are the total sales and profit by branch?
🛍️ Which product line generates the highest sales and quantity sold?
📈 What is the month-over-month sales growth trend?
👥 Do members spend more than normal customers?
⚖️ Is there a spending difference between male and female customers?
🧾 What is the average invoice value per branch?
💳 Which payment method is used most frequently?
🕐 What time of day sees peak sales activity?
🏆 Which branches offer the best overall investment potential?