Pizza Place Sales Analysis — Excel Project
تفاصيل العمل
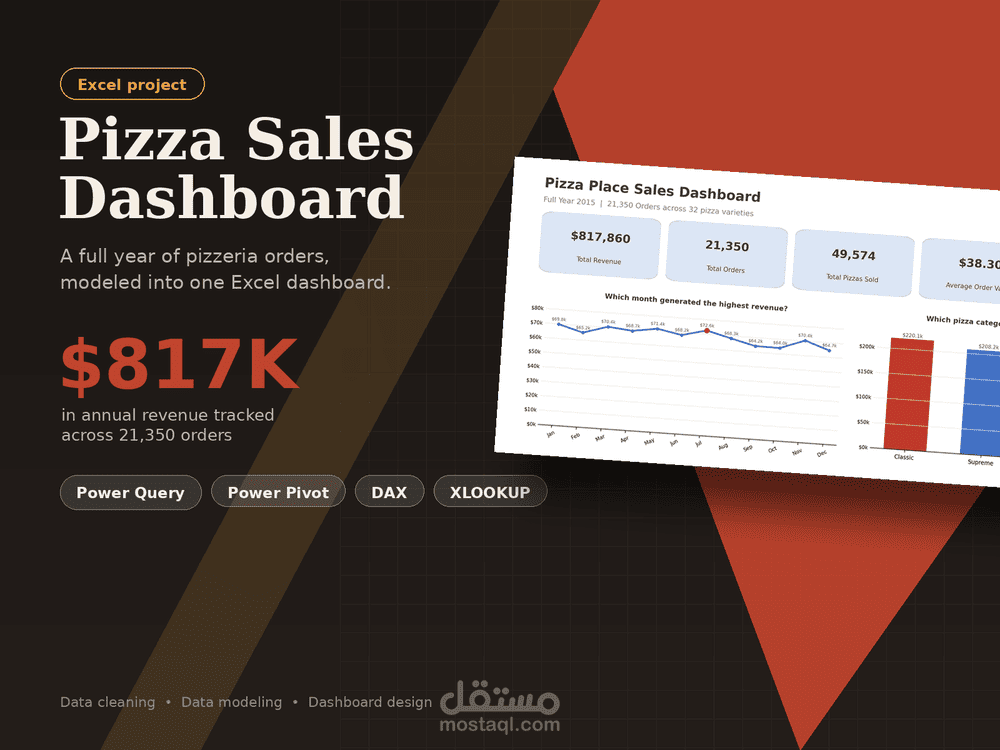
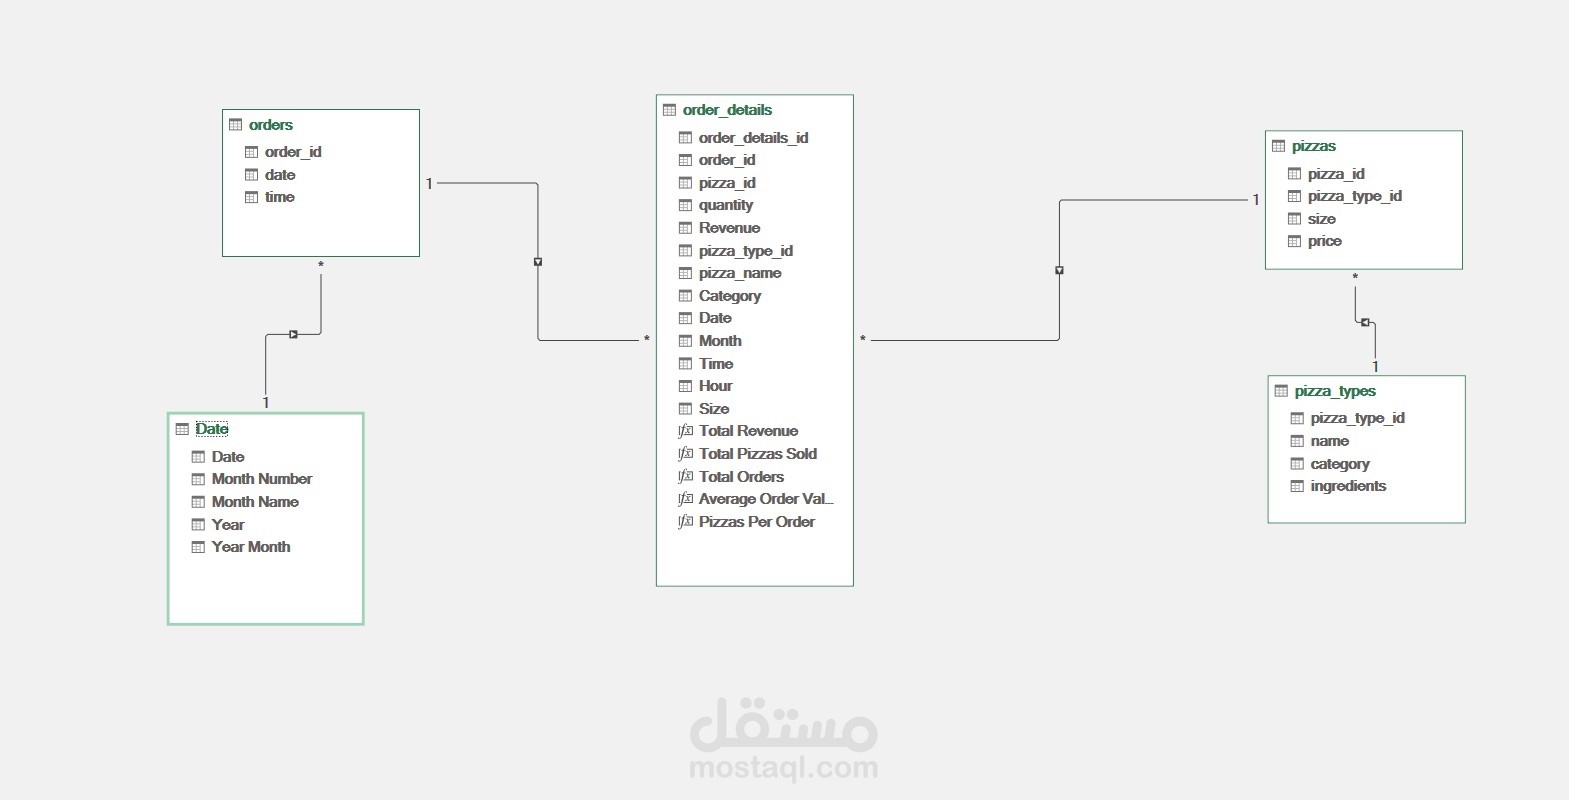
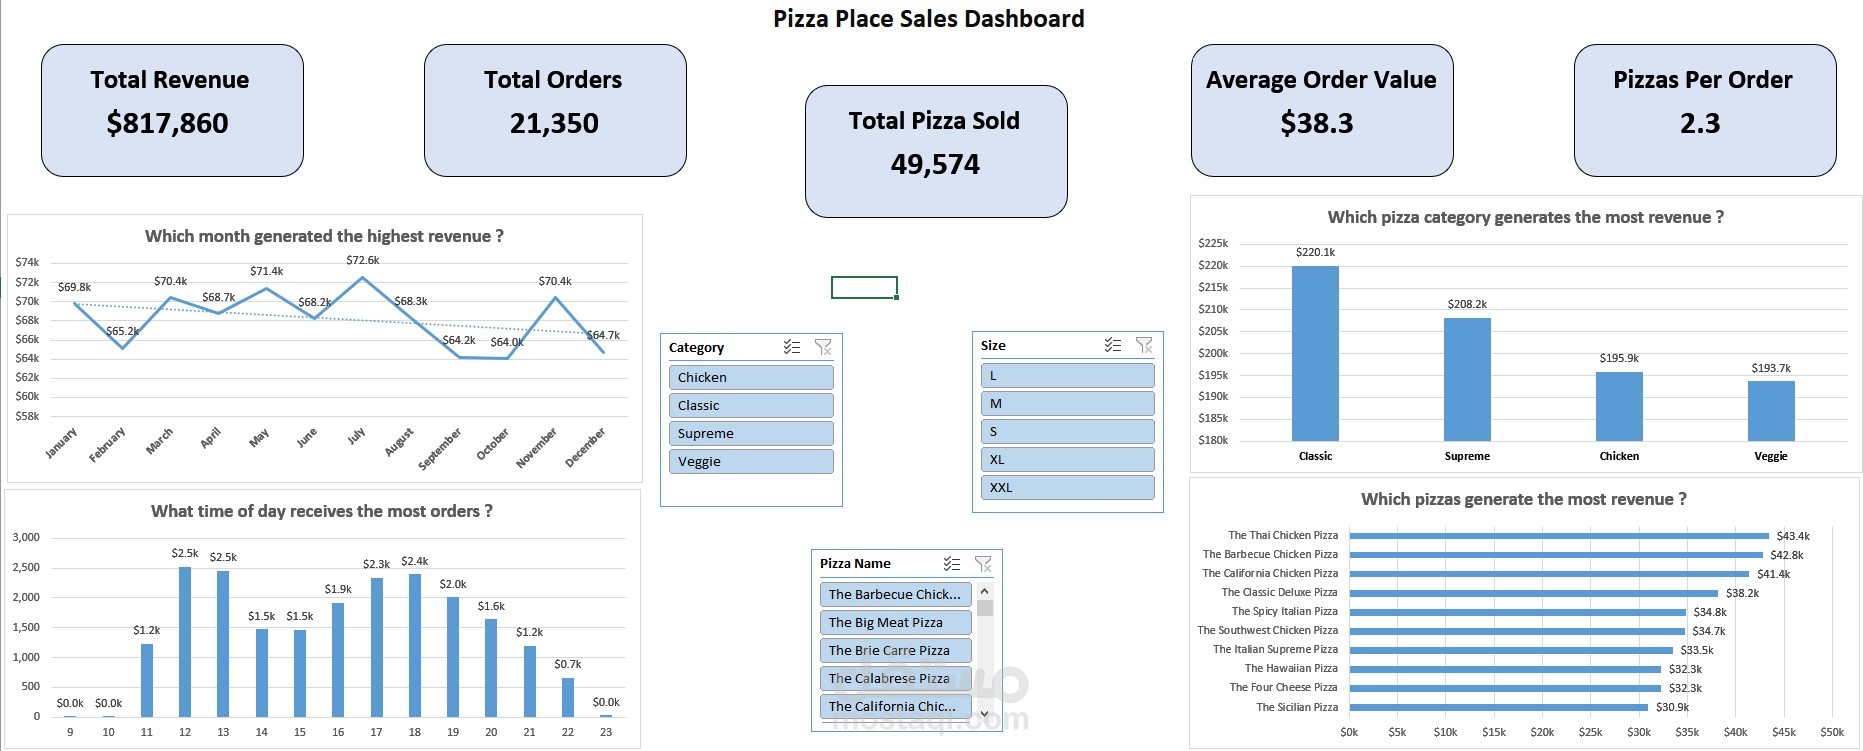
A pizza place needs to understand its own sales data: which months perform best, when orders peak during the day, which pizza categories and sizes drive revenue, and which specific pizzas are the top sellers. This project takes four raw, relational CSV files and turns them into a clean, connected data model with a single interactive dashboard that answers those questions at a glance.
Tools & Techniques Used :
Excel Tables — every sheet is a structured Table for dynamic, self-expanding ranges
Power Query — importing and shaping the 4 CSVs into the workbook
Power Pivot / Data Model
DAX Measures
Dynamic Array Formulas
PivotTables & PivotCharts — feeding the dashboard visuals
Slicers — Category, Size, and Pizza Name, for interactive filtering
One-page Dashboard — KPI cards + 4 charts answering 4 core business questions
Project Workflow :
1. Import & clean with Power Query
2. Build a full Date dimension table
3. Enrich the fact table with XLOOKUP
4. Build the data model in Power Pivot
5. Write DAX measures
6. PivotTables → PivotCharts → Dashboard
📊 The Dashboard — 4 Questions, Answered
Question :
Which month generated the highest revenue?
What time of day receives the most orders?
Which pizza category generates the most revenue?
Which pizzas generate the most revenue?