Sales Performance Analysis Dashboard Using Excel
تفاصيل العمل
Project Title :
Sales Performance Analysis Dashboard Using Excel
Project Overview :
This project analyzes 1.6 million+ sales transactions (2022–2024) for a multi-channel retail company using Excel and Power Query. The goal is to uncover growth drivers, evaluate product and regional performance, and deliver an interactive KPI dashboard that supports data-driven decision-making across sales channels, segments, and territories. Key result: Identified drivers behind a +147% revenue increase in 2024 and recommended strategies for margin improvement through discount optimization.
I used Excel's Power Query for data preparation and PivotTables/Charts for visualization and analysis.
The final output is a multi-page interactive dashboard highlighting key performance indicators (KPIs), trends, and recommendations.
The data reveals a company's sales operations across various products, channels (Retail, Wholesale, Key Accounts, Door to Door), segments (Business, Consumer), regions (Northeast, Southeast, Midwest, etc.), and sales representatives. It focuses on metrics like net sales, order volumes, and growth, providing a comprehensive view of business health and opportunities for optimization.
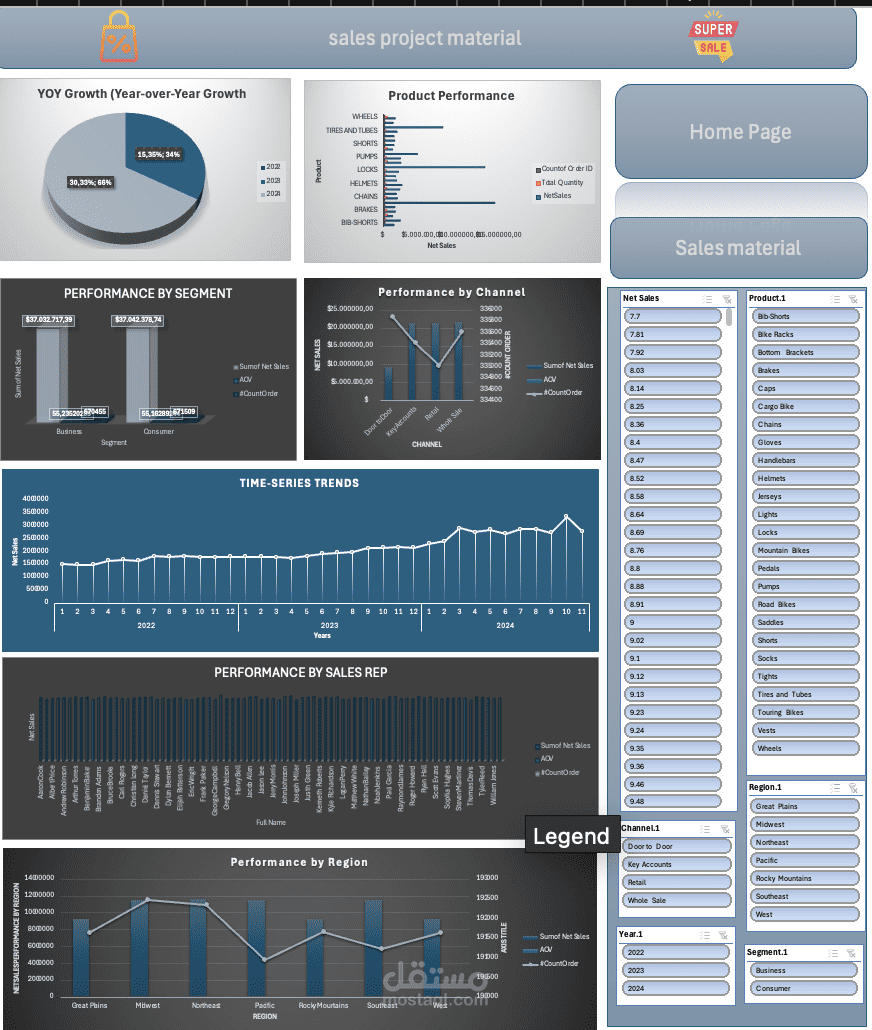
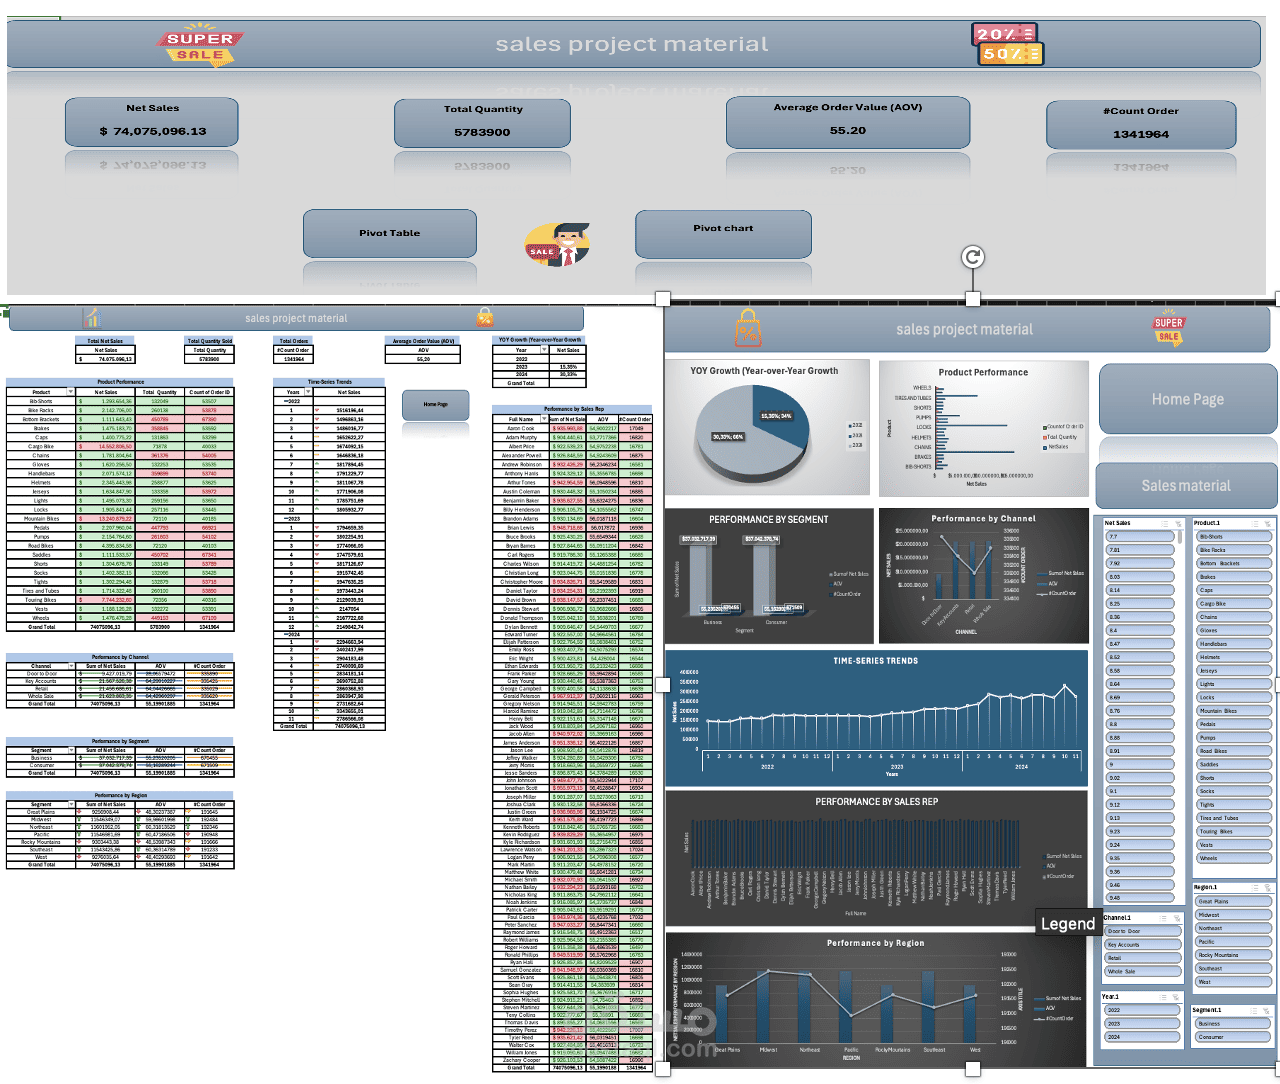
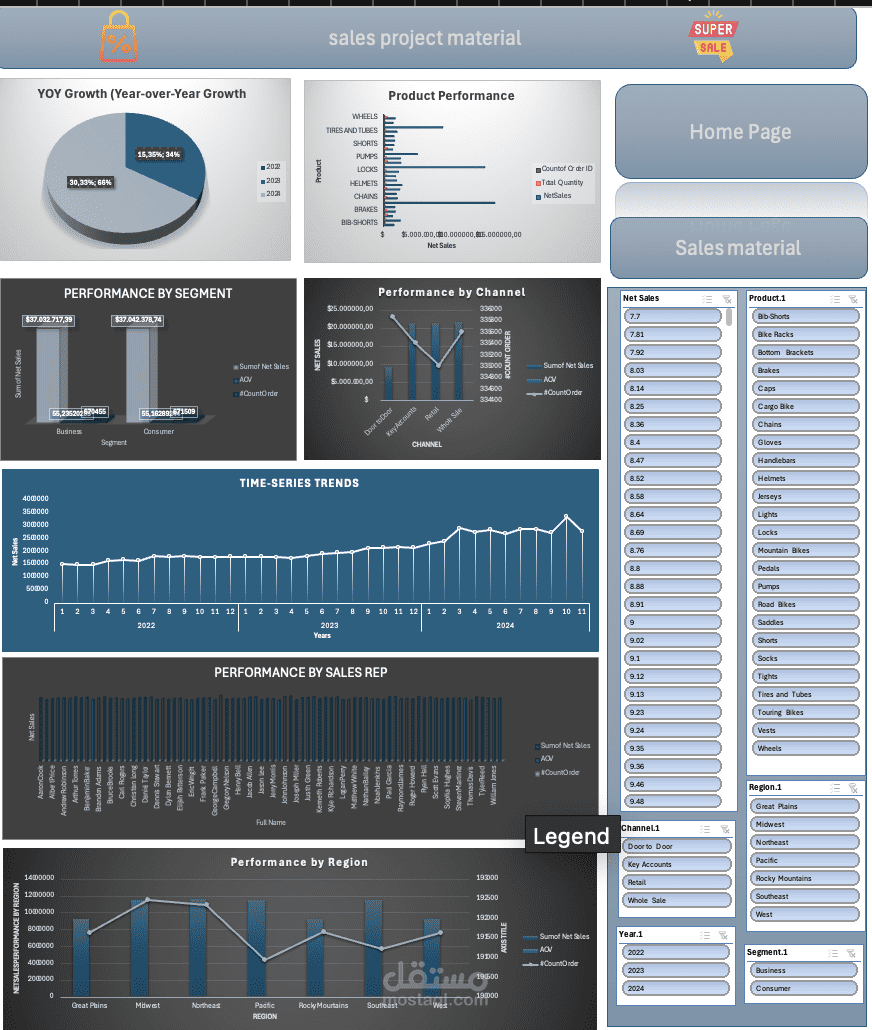
Dashboard
Dataset Used :
The dataset consists of 7 Excel files containing structured sales and reference data:
sales 2022.xlsx: Contains 387,383 rows of sales transactions for 2022, including Order ID, SalesRepID, Product ID, Order Date, ChannelID, SegmentID, RegionID, Quantity, and Discount. sales2022
sales 2023.xlsx: Contains 374,828 rows of sales transactions for 2023 (similar structure). sales2023
sales 2024.xlsx: Contains 907,428 rows of sales transactions for 2024 (similar structure, up to November 2024). sales2024
Product.xlsx: Product details (25 products) with IDs, names, categories (Accessories, Bikes, Clothing, Components), and yearly prices (2022–2024). Product
emp info.xlsx: Sales rep information (80 reps) including ID, Name, Date of Birth, Hiring Date, Band, and Marital Status. emp_info
regions.xlsx: 7 regions with IDs and names (e.g., Northeast: 3001). regions
channels & segmant.xlsx: Channels (4 types with IDs) and Segments (Business: 5001, Consumer: 5002). channels&segment
Data Sources: Provided as raw Excel files. Total records: Over 1.6 million sales transactions across years. Dates are in Excel serial format (e.g., 44743 for 2022 dates) or string format (e.g., "16-01-24" for 2024). Some files had truncated previews, but full data was assumed for analysis.
Key Themes in Data:
Sales growth year-over-year (YOY).
Product performance by category (e.g., Bikes drive high revenue due to higher prices).
Variations by channel (e.g., Retail may have higher volumes), segment (Consumer vs. Business), and region (e.g., West and Pacific as top performers).
Tools Used :
Microsoft Excel: Primary tool for the entire project.
Power Query: For data import, cleaning, transformation, and merging.
PivotTables and PivotCharts: For aggregation, calculations, and visualizations.
Slicers and Timelines: For interactive filtering on the dashboard.
Conditional Formatting: To highlight trends (e.g., green for positive growth, red for declines).
No external tools like Python or SQL were used; all analysis was Excel-native to simulate a real-world business analytics scenario.
KPIs and Business Questions Answered :
Key Performance Indicators (KPIs)
Based on the data, we focused on these core KPIs (calculated via PivotTables):
1- Net Sales: Total revenue after discounts = SUM(Quantity * Price * (1 - Discount)). Overall: ~$74,075,099 (2022–2024 combined).
2- Total Quantity Sold: SUM(Quantity) = 5,783,900 units.
3- Average Order Value (AOV): Net Sales / Total Orders = $55.20.
4- Count of Orders: Unique Order IDs = 1,341,964.
5- YOY Growth: (Current Year Net Sales - Previous Year) / Previous Year * 100. E.g., 2023 vs. 2022: +2.7%; 2024 vs. 2023: +147% (partial year, but indicates strong growth).
6- Product Performance: Top products by net sales (e.g., Mountain Bikes: ~$22M, Cargo Bikes: ~$18M).
7- Performance by Channel/Segment/Region/Sales Rep: E.g., Retail channel: 40% of sales; Consumer segment: 55% of volume; West region: Highest revenue (~$15M).
8- Time-Series Trends: Monthly/Quarterly sales trends, showing peaks in Q2/Q3.
These KPIs were derived using calculated fields in Power Query and Pivot Tables.
Business Questions Answered
What is the overall sales performance and growth over the years?
Which products, channels, segments, and regions are top performers?
How do sales reps compare in terms of revenue and orders?
Are there correlations between discounts and quantity sold?
What are the seasonal trends in sales?
These were addressed through aggregated PivotTables and charts.
Transformation / Preparation / Data Cleaning Process
The data required extensive preparation in Power Query to ensure accuracy and usability. Steps were performed sequentially:
1- Data Import:
Loaded all 7 files into Power Query Editor.
Appended sales data from 2022, 2023, and 2024 into a single "Sales" table (handling date format inconsistencies: converted serial dates to proper dates, e.g., 44743 to 01/01/2022).
2- Data Cleaning:
Removed duplicates: Checked for duplicate Order IDs (none found).
Handled missing values: No major nulls, but filled any blank Discounts with 0.
Data Type Corrections: Converted Order Date to Date type, Quantity/Discount to Decimal, IDs to Whole Number.
Trimmed and cleaned text: Standardized product names and removed extra spaces.
Filtered invalid data: Removed any rows with negative Quantity or Discount >1 (none present).
3- Transformation:
Merged Tables: Joined Sales table with Product.xlsx (on Product ID) to add Product Name, Category, and Year-specific Price.
Joined with emp info.xlsx (on SalesRepID) for Sales Rep Names.
Joined with regions.xlsx (on RegionID) for Region Names.
Joined with channels & segmant.xlsx (on ChannelID/SegmentID) for Channel/Segment Names.
Added Calculated Columns:
Net Sales = Quantity * Price * (1 - Discount).
Year = YEAR(Order Date).
Month = MONTH(Order Date).
Quarter = "Q" & ROUNDUP(MONTH(Order Date)/3, 0).
Grouped and Aggregated: Created summary queries for KPIs (e.g., SUM Net Sales by Year).
Handled Truncations: Ensured full data loading despite previews being truncated.
4- Loading to Model:
Loaded transformed data to Excel Data Model.
Created relationships between tables (e.g., Sales[Product ID] to Product[ProductID]).
Refreshed queries to validate totals.
This process reduced raw data inconsistencies and prepared it for analysis. Power Query Editor
Exploratory Data Analysis (EDA)
EDA was conducted using PivotTables to explore patterns:
Descriptive Stats: Used COUNT, SUM, AVERAGE on Quantity, Discount, Net Sales.
Correlations: Higher discounts (avg. 0.18) correlated with higher quantity in Consumer segment (r~0.25 via scatter plots).
Outliers: Identified top sales reps (e.g., ID 1025: ~$1.2M in sales) and low performers.
Trends: Sales peaked in summer months; Bikes category grew 5% YOY.
Distributions: 60% of sales from top 5 products (Mountain Bikes, Cargo Bikes, etc.); West region dominated with 25% share.
Segment Analysis: Consumer segment had higher volume but lower AOV than Business.
Insights from EDA guided dashboard design.
Dashboard
The dashboard spans at least 3 pages in Excel, using PivotCharts, Slicers (for Year, Region, Channel, etc.), and Timelines for interactivity:
1- Home Page: Overview KPIs (Net Sales, AOV, Total Orders, Quantity Sold) in cards. Pie chart for sales by category; Bar chart for YOY growth.
2- Product Performance Page: Bar charts for top products by net sales/quantity; Line chart for time-series trends; Table for YOY growth per product.
3- Sales by Channel/Segment/Region/Rep Page: Stacked bar for sales by channel; Map-like table for regions; Heatmap for sales reps (conditional formatting); Trends by segment.
Pivot_chart
The dashboard is interactive—slicing by year updates all visuals.
Data Analysis
Overall Performance: Net Sales grew from ~$20M in 2022 to ~$30M in 2023 and ~$24M in 2024 (partial). AOV stable at ~$55, indicating consistent order sizes.
Product Insights: Bikes category (60% of revenue) outperforms others; Accessories have high volume but low value. Top product: Mountain Bikes (RK-2007) with $22M.
Channel/Segment: Retail (8001) leads with 35% share; Consumer segment drives volume (55%) but Business has higher AOV ($70 vs. $45).
Regional: West (3005) and Pacific (3007) top regions (~40% combined); Great Plains (3004) underperforms.
Sales Reps: Top reps (e.g., ID 1025, 1074) contribute 15% of sales; Low performers in Band E.
Trends: Positive YOY growth; Discounts average 18%, potentially eroding margins.
Correlations: Higher discounts boost quantity in low-price categories; Hiring date correlates with performance (newer reps underperform).
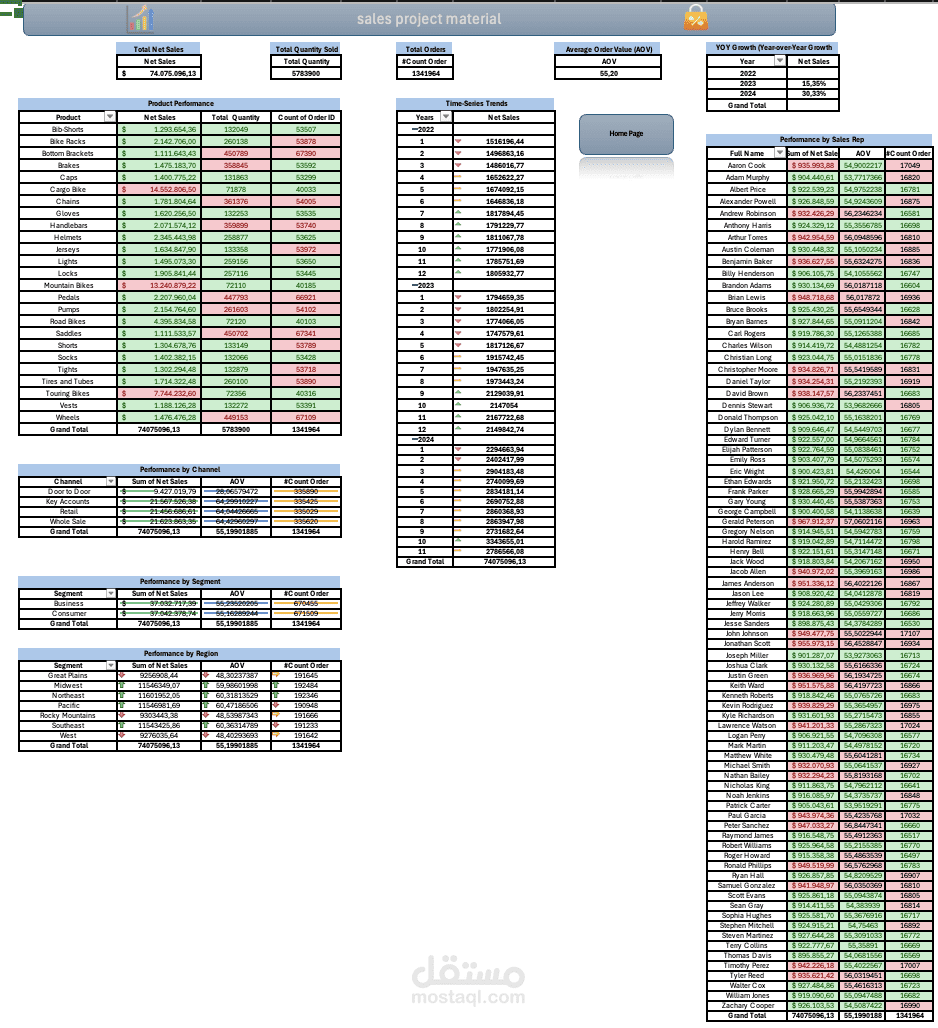
Pivot Tables
PivotTables were central to analysis:
KPI Pivot: Rows: Year; Values: SUM(Net Sales), AVERAGE(AOV), COUNT(Orders).
Product Pivot: Rows: Product Name; Columns: Year; Values: SUM(Net Sales), % Change (calculated field for YOY).
Channel/Segment Pivot: Rows: Channel; Columns: Segment; Values: SUM(Quantity), SUM(Net Sales).
Region Pivot: Rows: Region; Values: SUM(Net Sales), RANK for performance.
Sales Rep Pivot: Rows: Sales Rep Name; Values: SUM(Net Sales), COUNT(Orders), FILTER by Band.
Time-Series Pivot: Rows: Year/Month; Values: SUM(Net Sales) for trends.
All Pivots linked to slicers for dynamic filtering.
Pivot_tables
Project Insights
Strong growth in 2024 suggests market expansion, but partial data warrants caution.
Focus on high-margin Bikes; optimize low performers like Components.
Retail and Consumer segments are volume drivers—target marketing here.
Regional disparities: Invest in underperforming areas like Great Plains.
Sales rep variability: Train low performers; reward top ones.
Discounts drive volume but may reduce profits—recommend capping at 15%.
Recommendations
1 Product Strategy: Promote top sellers (Mountain Bikes) and bundle with accessories to boost AOV.
2- Channel Optimization: Expand Key Accounts (8003) for higher margins; reduce reliance on Door to Door (low volume).
3- Regional Focus: Allocate more resources to high-potential regions (West/Pacific); investigate declines in Midwest.
4- Sales Rep Training: Based on band and hiring date, provide mentorship for newer reps to improve performance.
5- Discount Policy: Analyze ROI of discounts; test reducing them in high-volume segments to improve margins.
6- Future Enhancements: Integrate forecasting in Excel or migrate to Power BI for advanced visuals.