Pivot table and dashboards
تفاصيل العمل
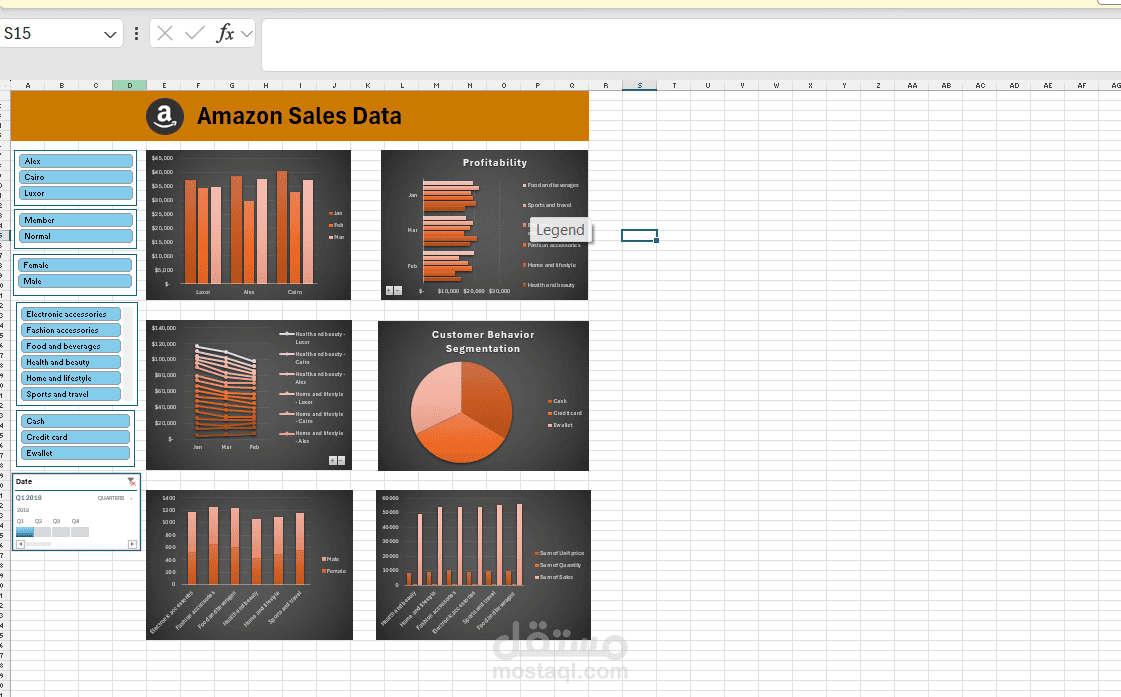
Amazon Sales Interactive Dashboard | Excel
Built an interactive sales analytics dashboard in Excel from a 1,000-record Amazon sales dataset, using 6 pivot tables to analyze sales trends across branches, product lines, and time periods
Designed 12 dynamic charts (bar, line, pie) to visualize revenue, profitability, payment method distribution, and customer rating patterns
Implemented slicers and a timeline filter (Branch, Customer Type, Gender, Product Line, Payment, Date) to enable real-time interactive filtering across the dashboard
Delivered actionable insights on top-performing branches, best-selling product categories, and customer purchasing behavior