Sales Performance & Analysis Dashboard | Excel & Tableau
تفاصيل العمل
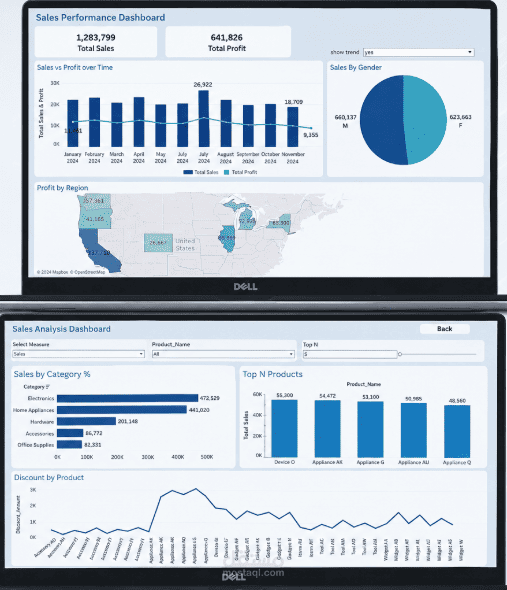
Developed interactive Sales Performance and Analysis Dashboards using Excel and Tableau to provide clear and actionable business insights. The project analyzes total sales, profit, sales trends, regional performance, customer demographics, product categories, top-performing products, and discount patterns. I created interactive visualizations, KPIs, filters, charts, and maps to help users explore the data and identify key trends and opportunities. This project demonstrates my skills in data analysis, data visualization, dashboard design, and transforming raw data into meaningful insights for better business decision-making.