Hiring & Employment Analysis Dashboard | Excel
تفاصيل العمل
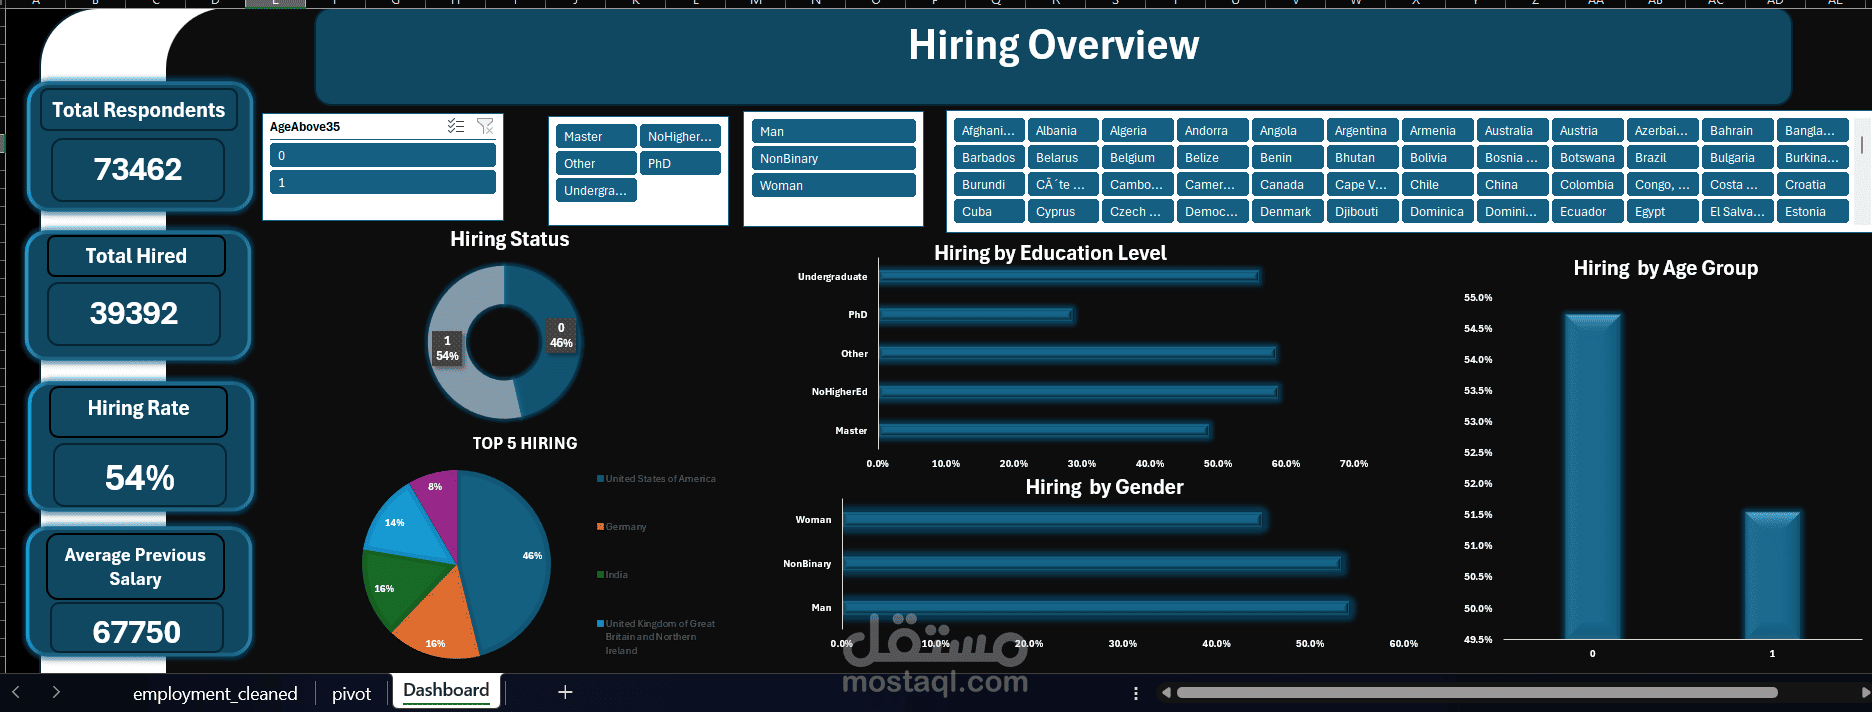
An interactive Hiring & Employment Dashboard developed using Microsoft Excel to analyze employment trends and identify key factors affecting hiring.
The dashboard provides insights into:
Total Respondents & Total Hired.
Overall Hiring Rate.
Average Previous Salary.
Hiring Status.
Hiring by Education Level.
Hiring by Age Group.
Hiring by Gender.
Top 5 Countries by Hiring.
Interactive filters for Age Group, Education Level, Gender, and Country.
The project demonstrates the use of Pivot Tables, KPIs, Charts, Slicers, Data Analysis, and Data Visualization to transform employment survey data into a clear and interactive business dashboard.