Gym members Dashboard
تفاصيل العمل
Members Dashboard – Power BI
I created this Members Dashboard in Power BI to provide a clear overview of membership data across different cities, age groups, and membership plans.
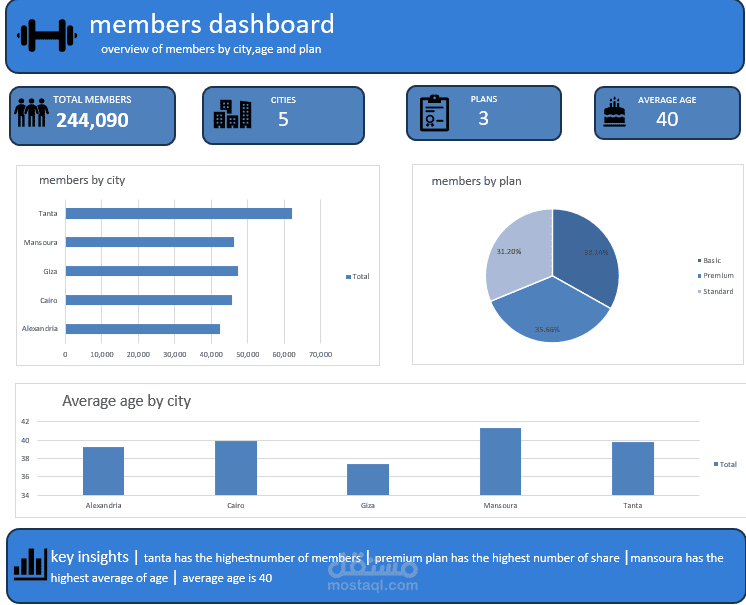
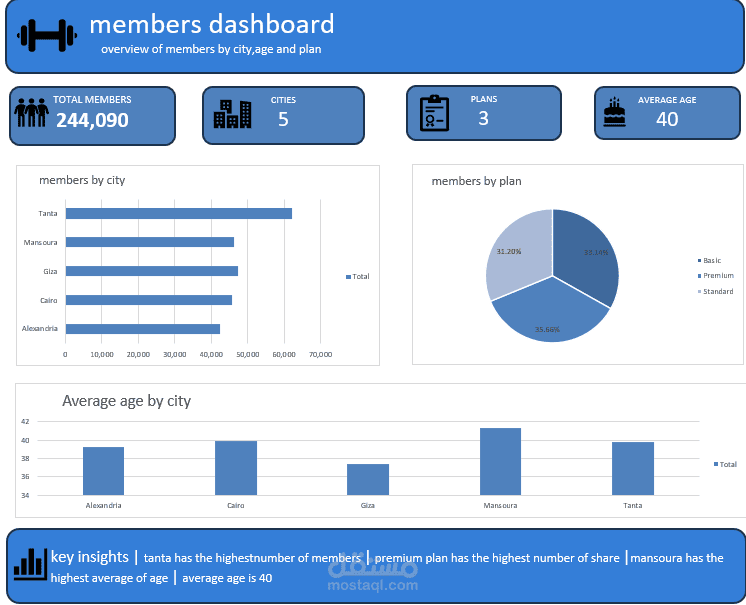
The dashboard highlights key KPIs including 244,090 total members, 5 cities, 3 membership plans, and an average member age of 40.
It includes visual analysis of members by city, membership distribution by plan, and average age by city. The dashboard also summarizes important insights, such as Tanta having the highest number of members, the Premium plan having the largest membership share, and Mansoura having the highest average member age.
This dashboard helps decision-makers understand member distribution, compare city performance, analyze plan popularity, and identify important demographic trends.
Tools & Skills: Power BI •Excel• Data Cleaning • Data Visualization • KPI Cards • Dashboard Design • Business Insights • Data Analysis