Budget vs Actual Expense Analysis in Excel with a Written Report
تفاصيل العمل
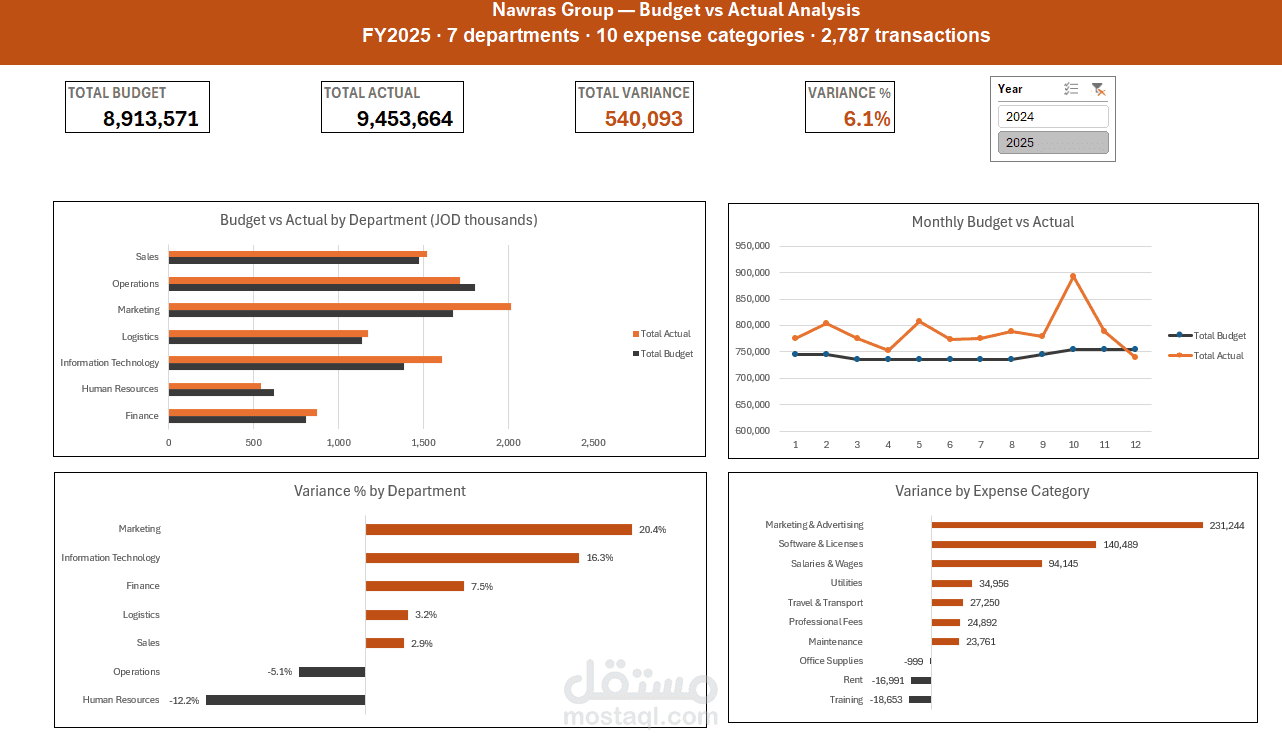
I analysed two years of operating expenditure for a company with
7 departments and 10 expense categories, and wrote the findings
up as a 5-page report.
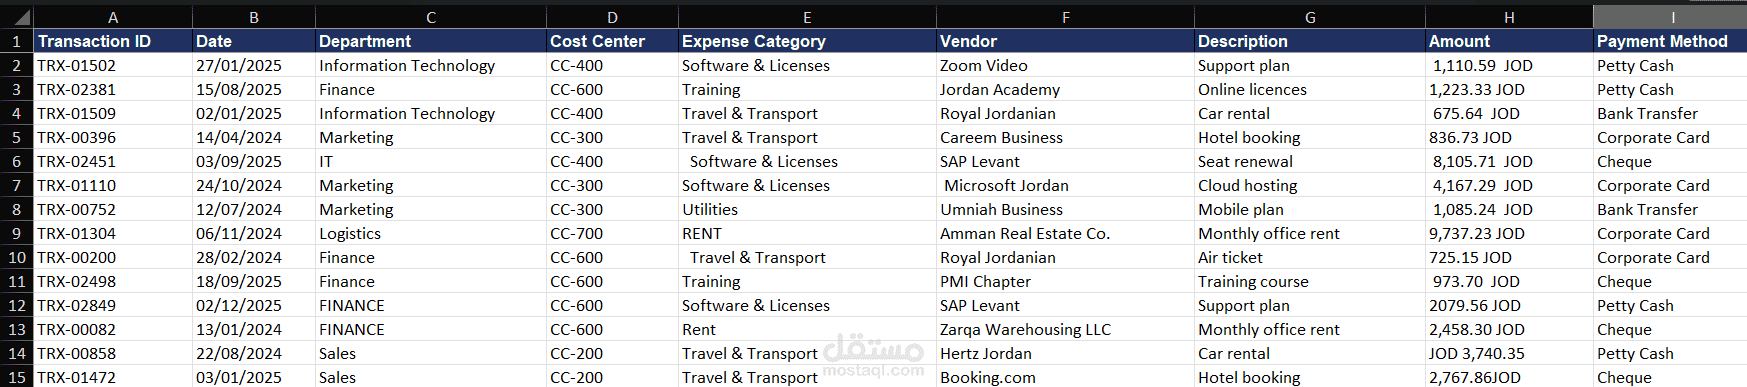
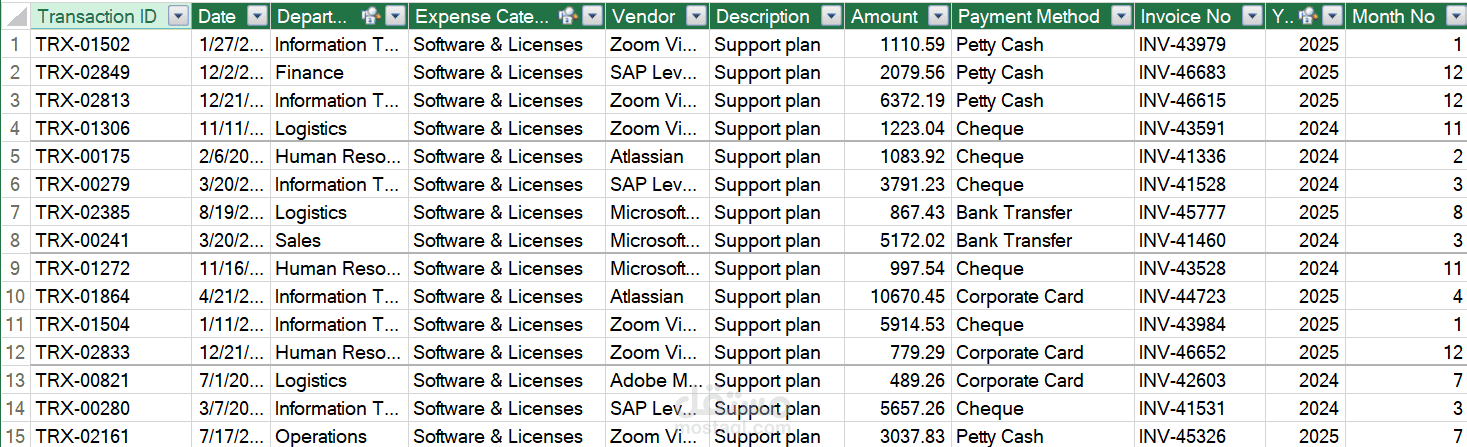
I started from a raw expense ledger with real problems in it:
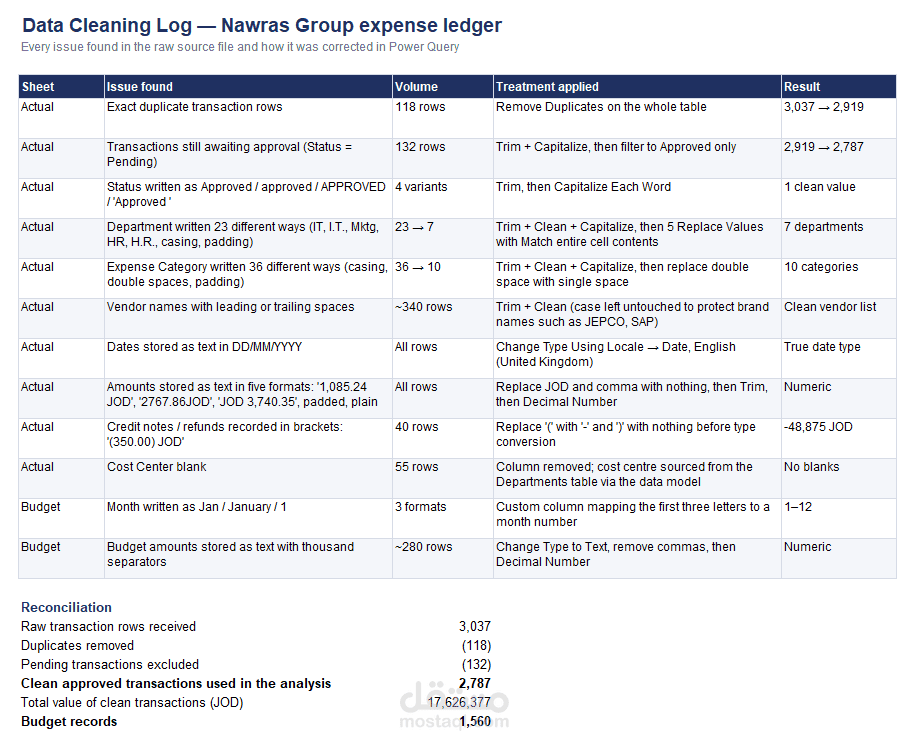
118 exact duplicate rows, 132 transactions still marked Pending,
department names written 23 different ways (IT / I.T. / Mktg / HR),
amounts stored as text with the currency inside the cell, credit
notes recorded in brackets, and dates stored as text.
What I did:
- Cleaned the ledger in Power Query and documented every single
correction on a Cleaning Log sheet, with a reconciliation from
3,037 raw rows down to 2,787 usable transactions.
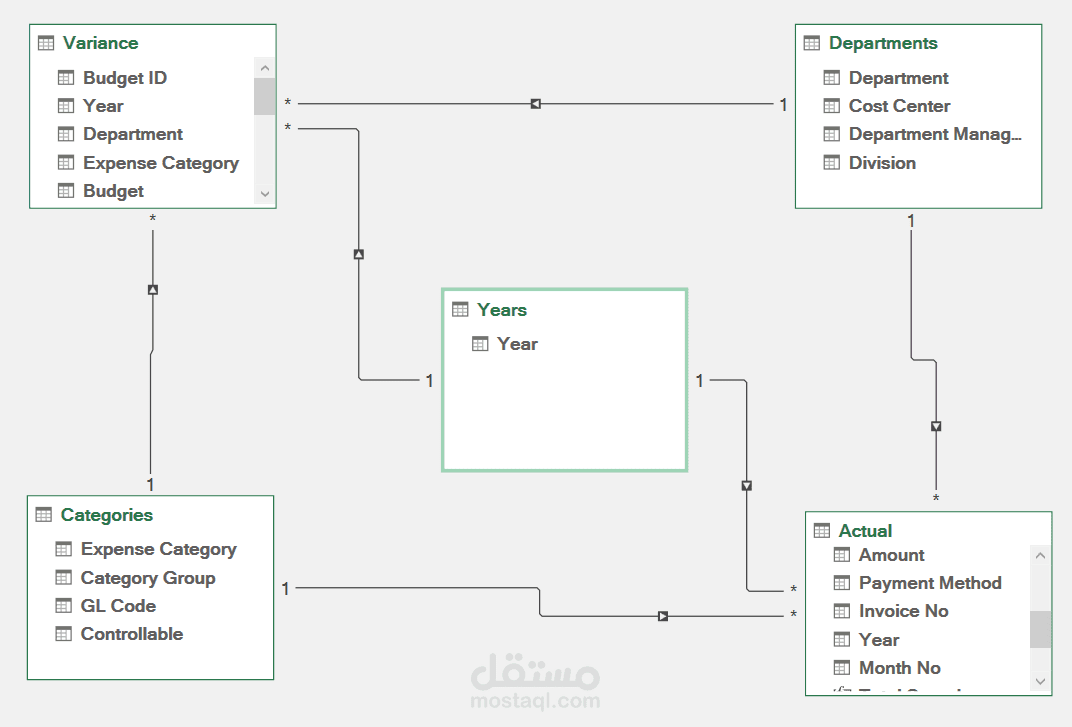
- Built a Power Pivot data model: two fact tables joined to shared
Department, Category and Year dimensions.
- Wrote 8 DAX measures for budget, actual, variance and variance %.
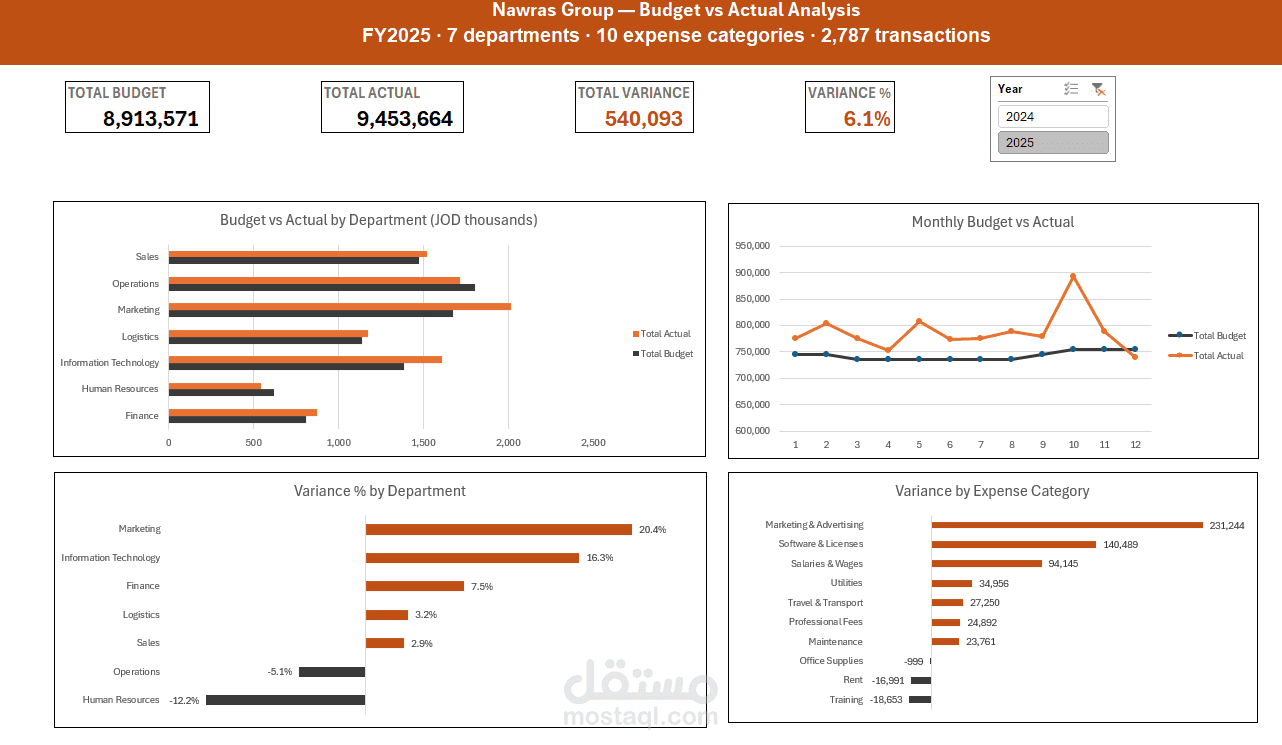
- Built 6 PivotTables and a dashboard with 4 KPI cards, 4 charts
and a year slicer that drives all of them.
- Wrote an analytical report covering methodology, the variance
breakdown, and 5 recommendations tied to specific numbers.
Key findings:
- FY2025 came in 6.1% over budget, after FY2024 closed 3.7% under.
The budget grew 5.0% year on year but actual spend grew 15.7%.
- 86% of the overrun sat in controllable spend, which ran 13.4%
over. Fixed commitments were only 1.4% over.
- Marketing (+20.4%) and IT (+16.3%) drove JOD 567,379 of adverse
variance, while HR and Operations left JOD 168,183 unspent — so
the problem is allocation as much as control.
Tools: Excel, Power Query, Power Pivot, DAX, PivotTables, Word
Note: this is a project I built on a fictional dataset to
demonstrate my method.