E-Commerce Sales Dashboard
تفاصيل العمل
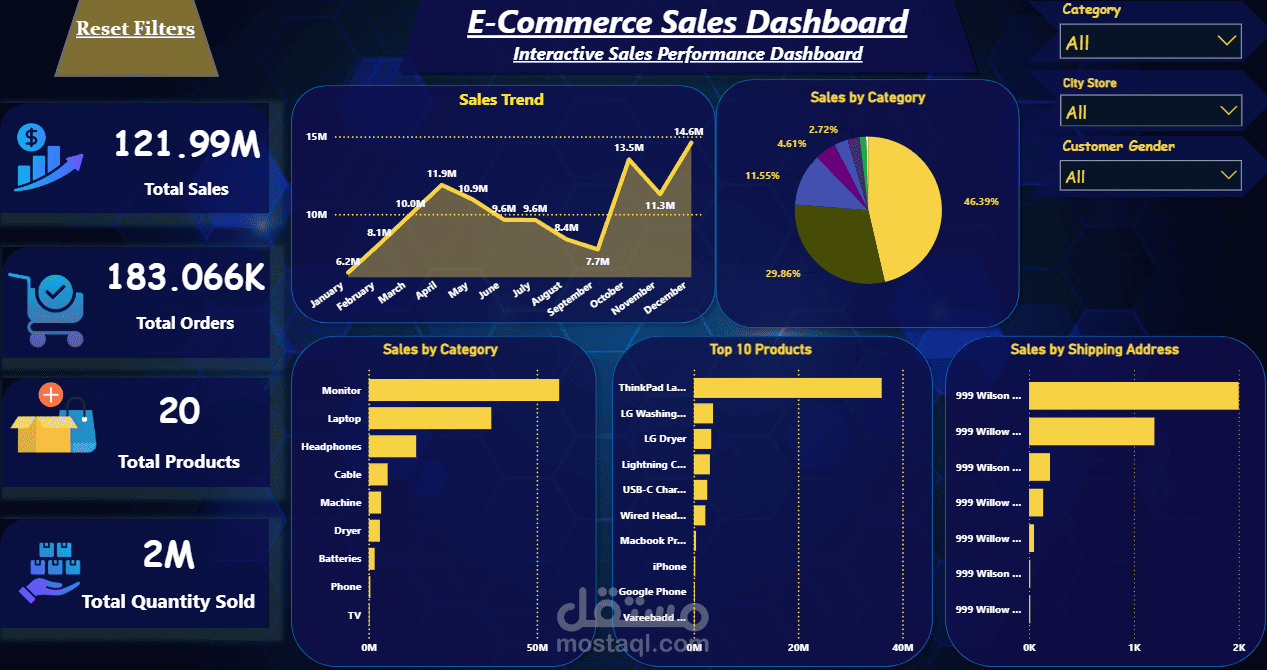
🛒 E-Commerce Sales Dashboard – Power BI
Developed an interactive E-Commerce Sales Dashboard using Power BI to analyze sales performance, orders, products, customer demographics, and sales trends across different categories and locations.
The dashboard provides a comprehensive overview of the business through key KPIs and interactive visualizations, helping users identify top-performing products, categories, and sales patterns.
Key Features:
💰 Total Sales analysis
🛒 Total Orders tracking
📦 Total Products and Quantity Sold
📈 Monthly Sales Trend
🏷️ Sales by Category
🏆 Top 10 Products by Sales
📍 Sales by Shipping Address
👥 Customer Gender analysis
🔎 Interactive filters for Category, City Store, and Customer Gender
🔄 Reset Filters functionality
Tools Used:
Power BI | Power Query | DAX | Data Visualization