Supply Chain and Delivery Rick Analysis
تفاصيل العمل
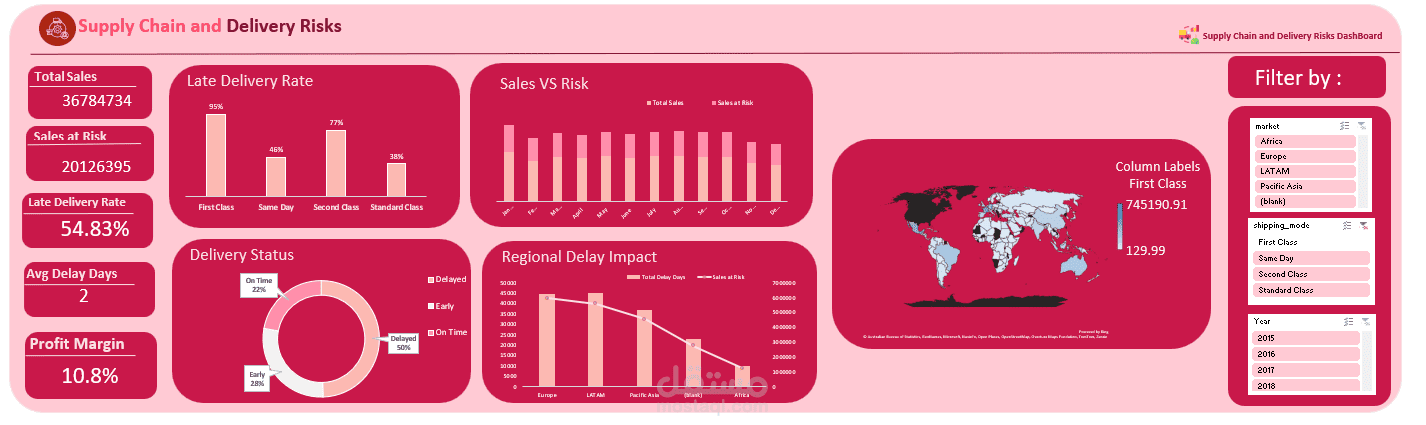
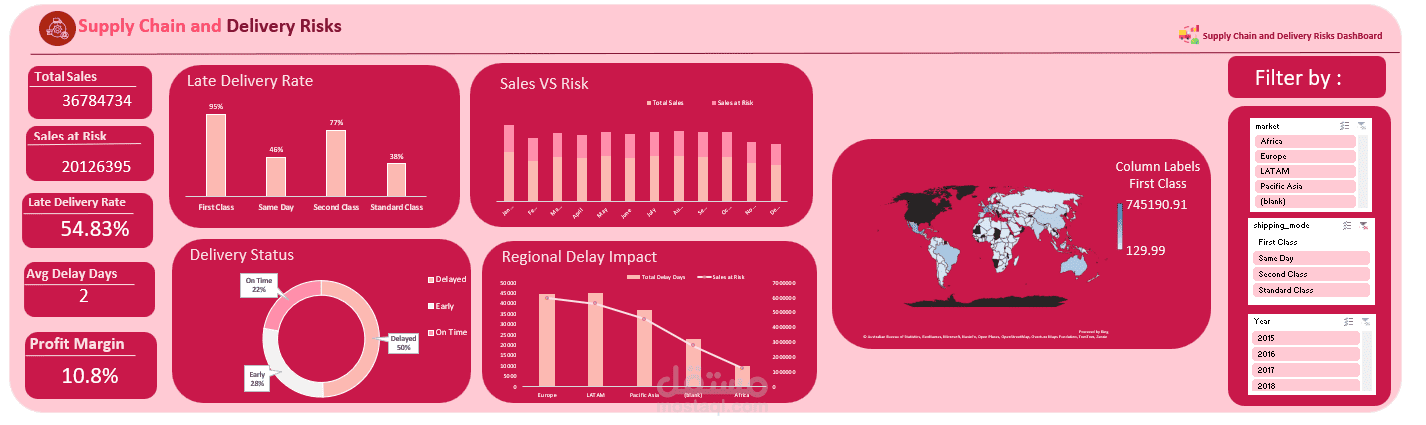
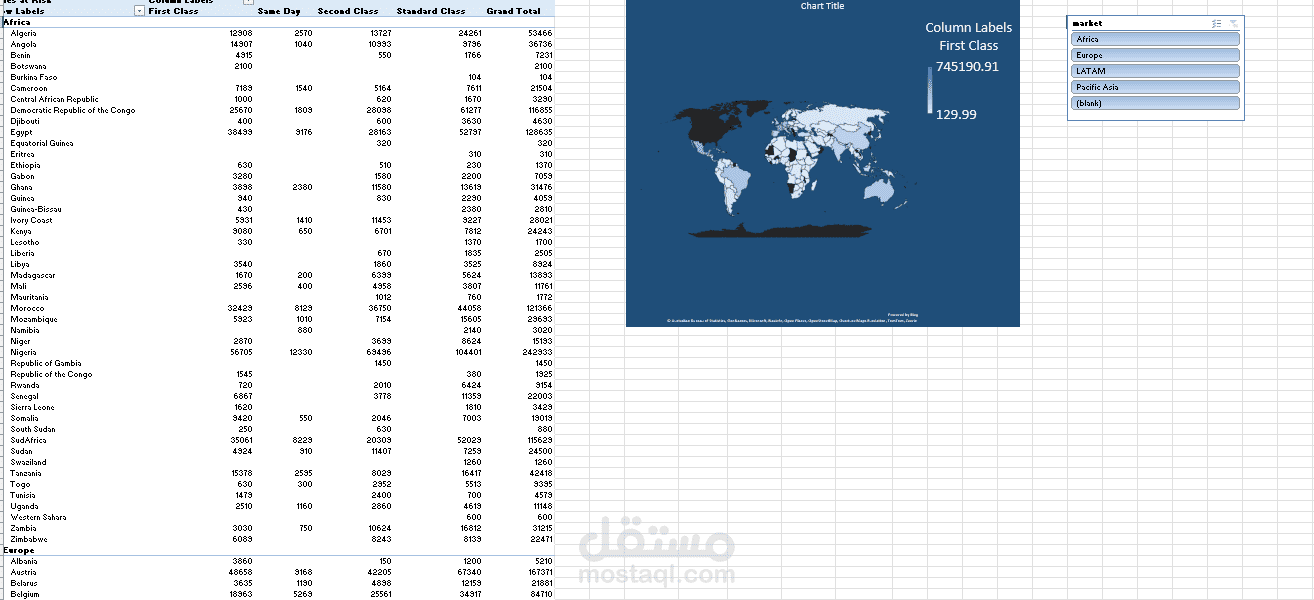
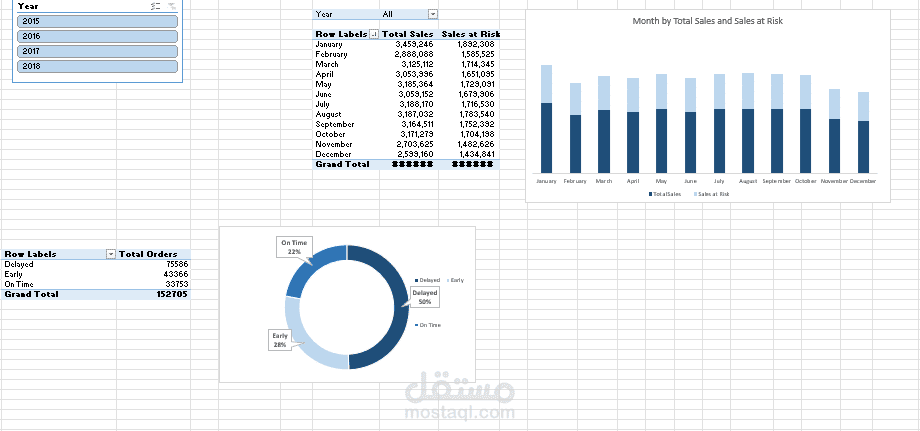
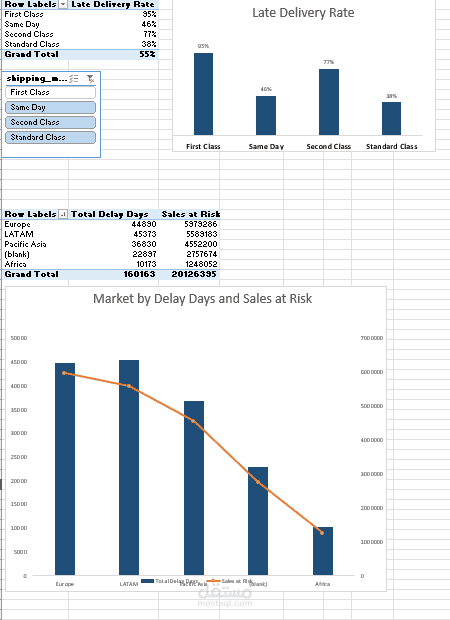
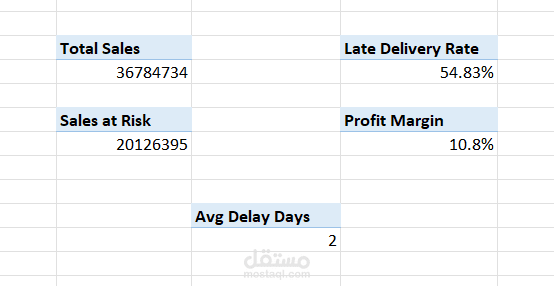
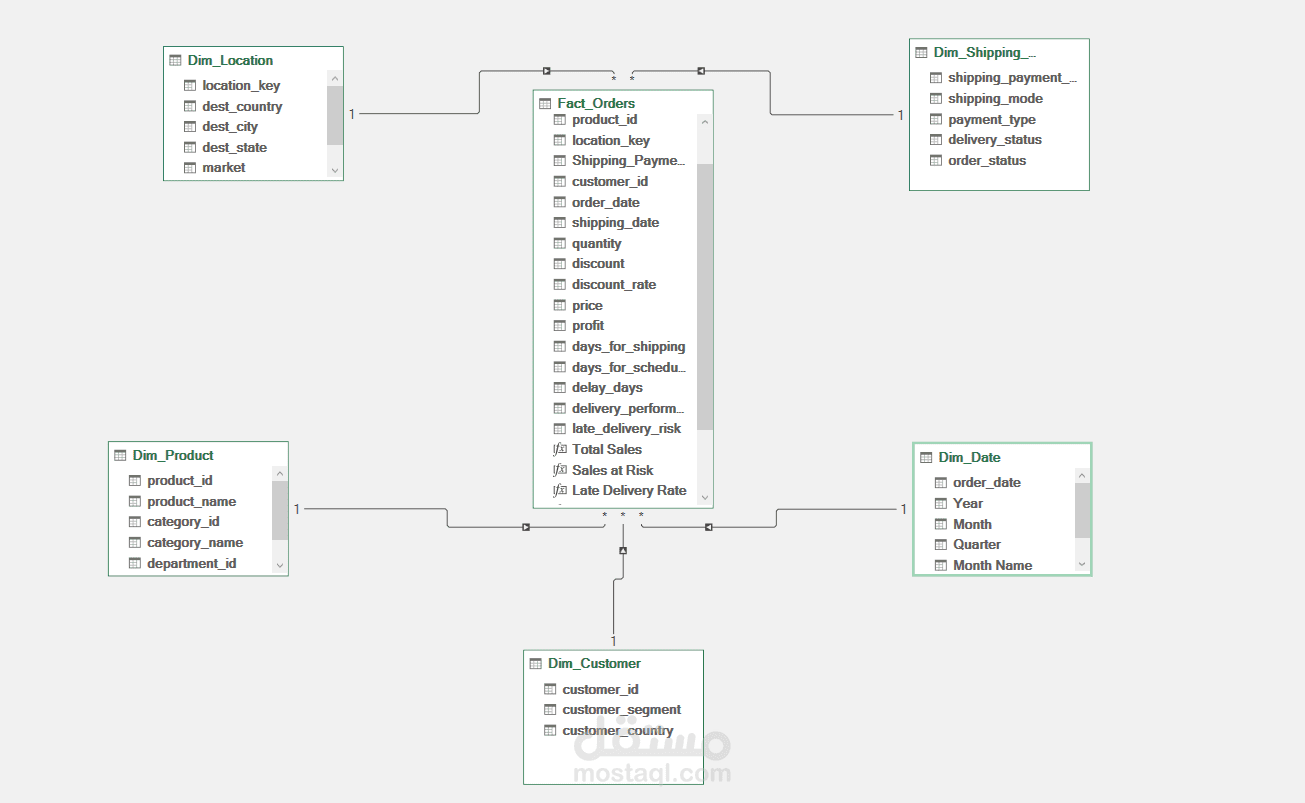
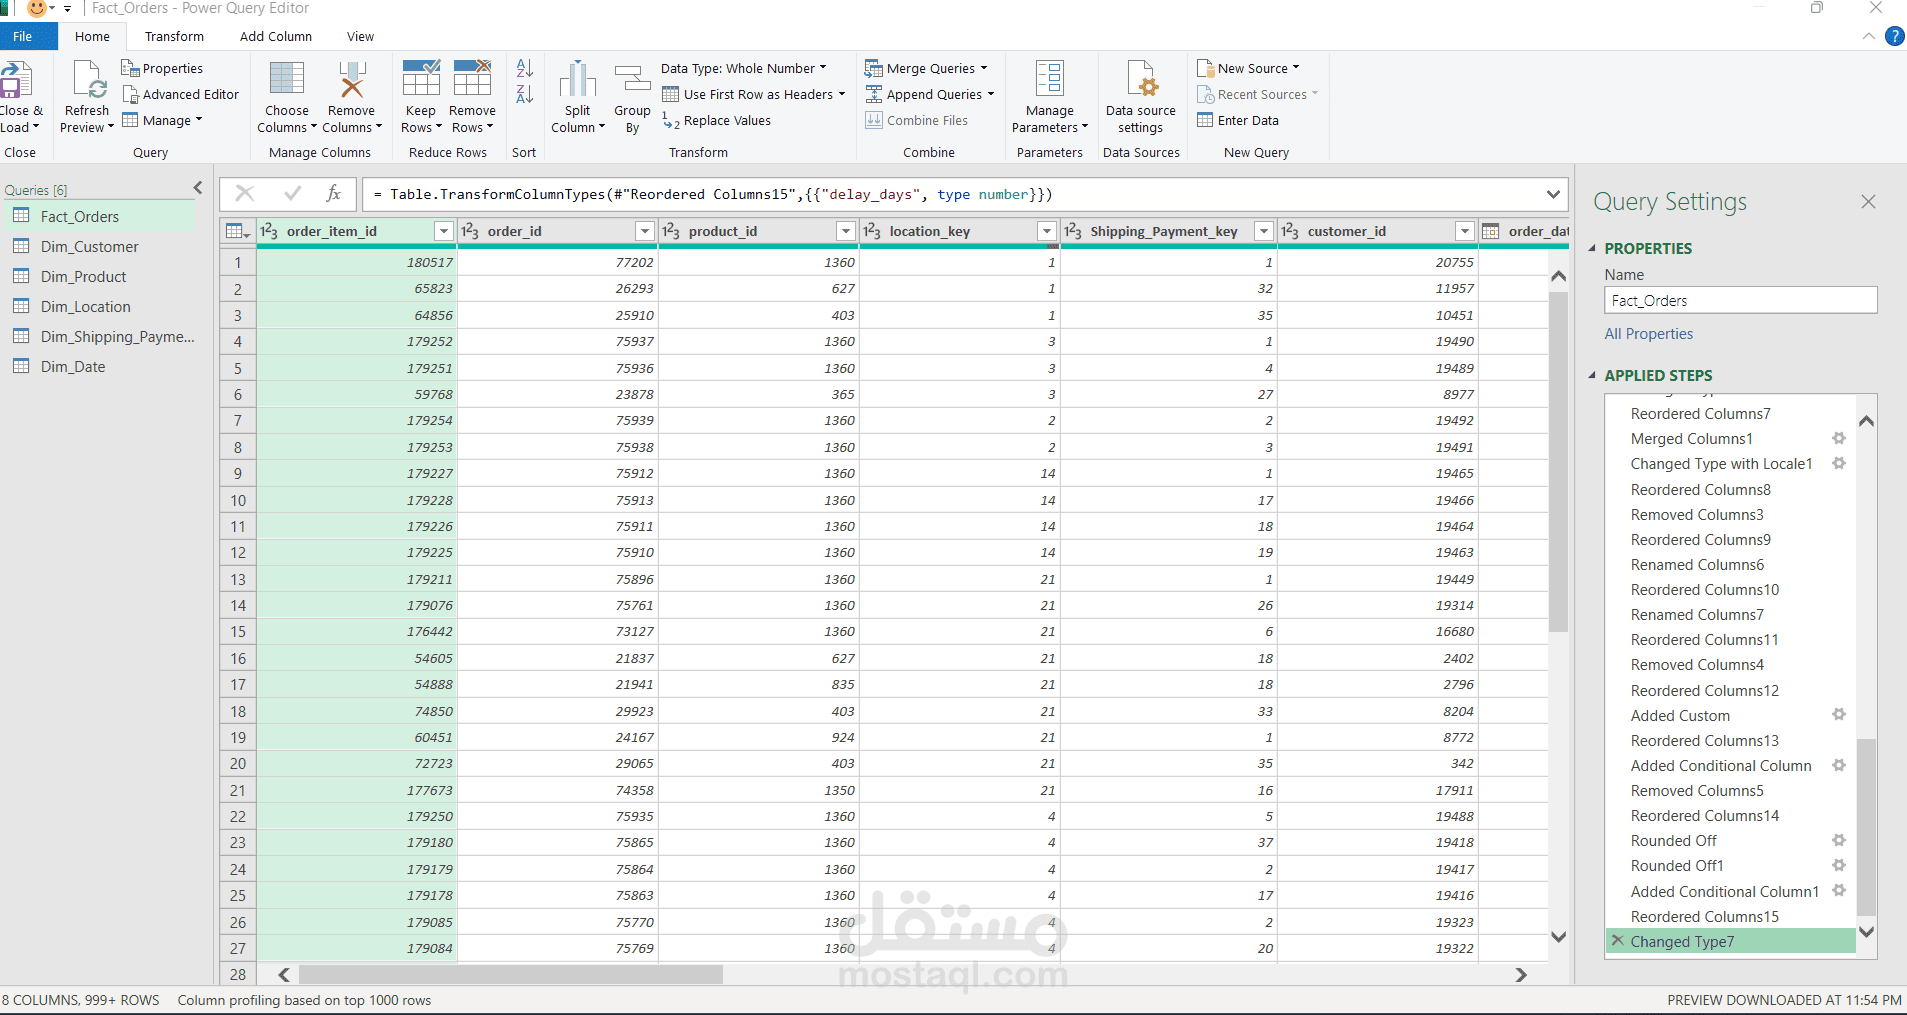
This project focused on analyzing a real-world dataset using Excel to transform raw data into meaningful insights.
I started by cleaning and preparing the dataset, handling missing values, checking data consistency, and organizing the data for analysis. I then used Excel functions and Pivot Tables to explore the data, identify patterns and trends, and compare different categories and metrics.
The analysis helped me understand how to work with raw data, choose relevant metrics, and present findings in a clear and useful way. I also created visualizations to make the results easier to understand and communicate.
Through this project, I gained hands-on experience in data cleaning, data analysis, Pivot Tables, Excel functions, data visualization, and interpreting analytical results.