super store
تفاصيل العمل
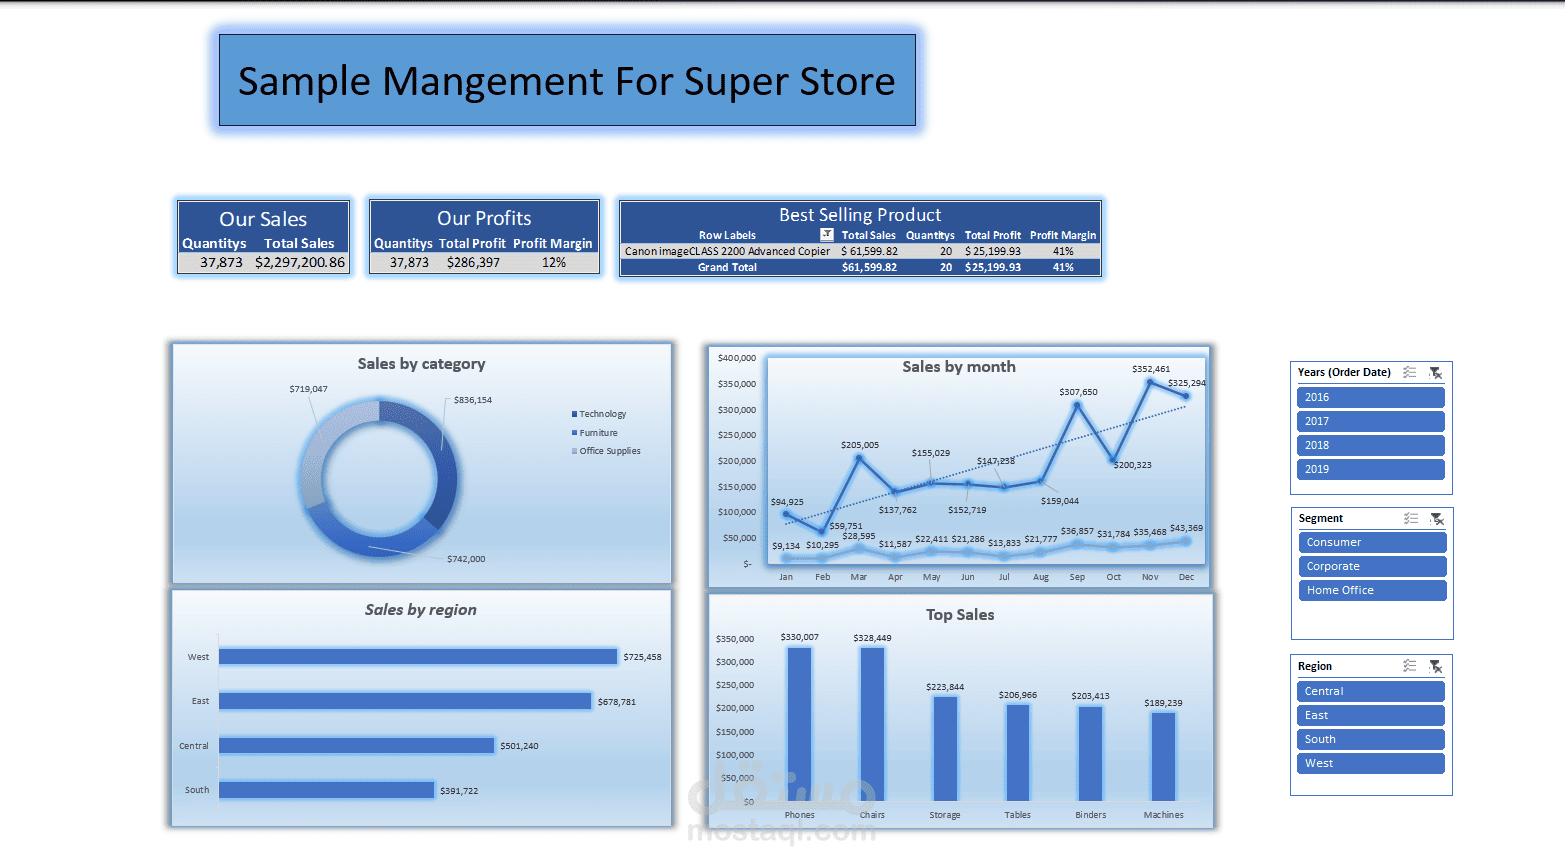
Just completed an interactive Excel Dashboard for Super Store Sales Analysis.
Through this project, I cleaned and analyzed the data, created Pivot Tables, built KPIs, and designed a dashboard to track sales, profits, top-performing products, regional performance, and monthly trends.
This experience enhanced my skills in Microsoft Excel, Data Analysis, Data Cleaning, Data Visualization, and Dashboard Creation.
Looking forward to continuing my learning journey and building more data-driven projects.