HR Analytics Dashboard in Power BI Workforce & Attrition Analysis
تفاصيل العمل
Built an interactive HR dashboard in Power BI for a company with
1,200 employees across 7 departments and 5 branches.
I started from four raw Excel sheets that had real data problems:
duplicate employee records, department names written in different
ways (IT / I.T. / Information Technology), dates stored as text,
salaries stored with the currency inside the cell, and blank values.
What I did:
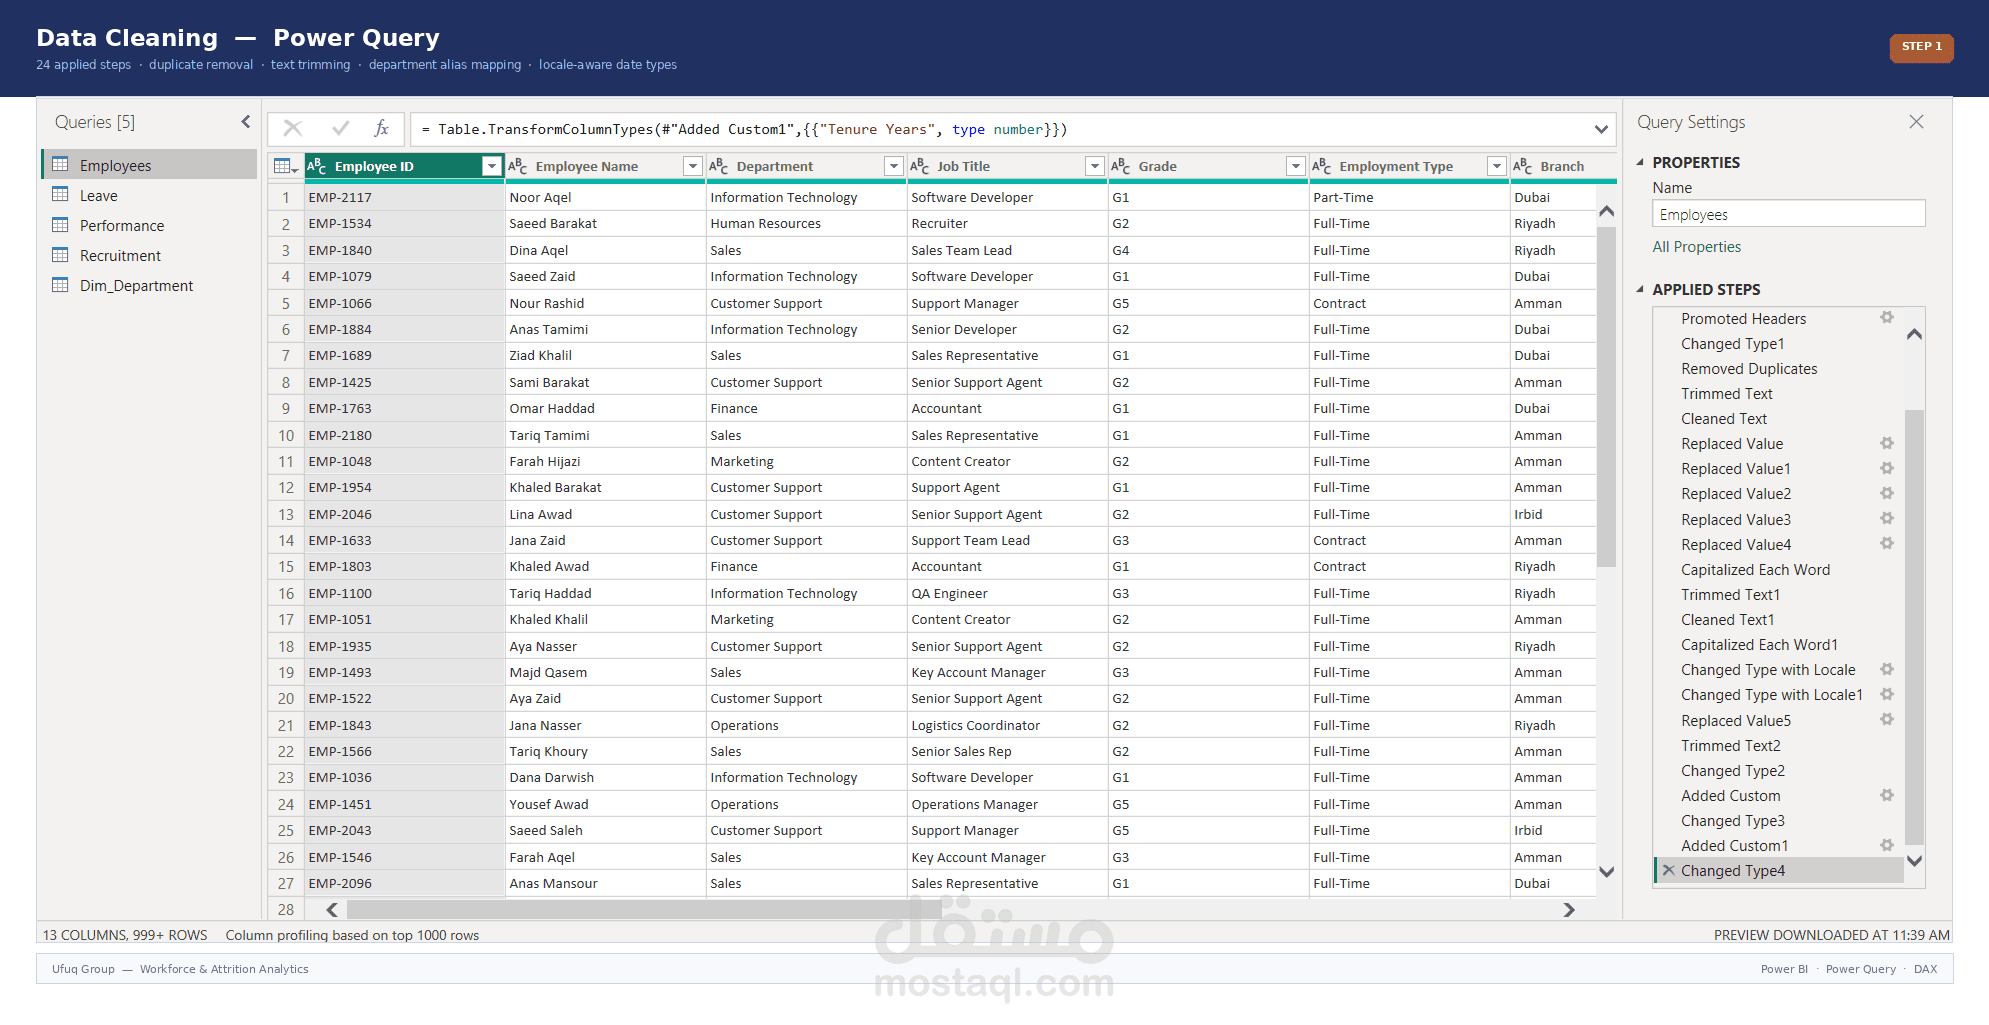
- Cleaned all four tables in Power Query (24 steps on the employee
table alone) — removed duplicates, unified department names,
converted dates using the correct locale, and split the salary
from the currency text.
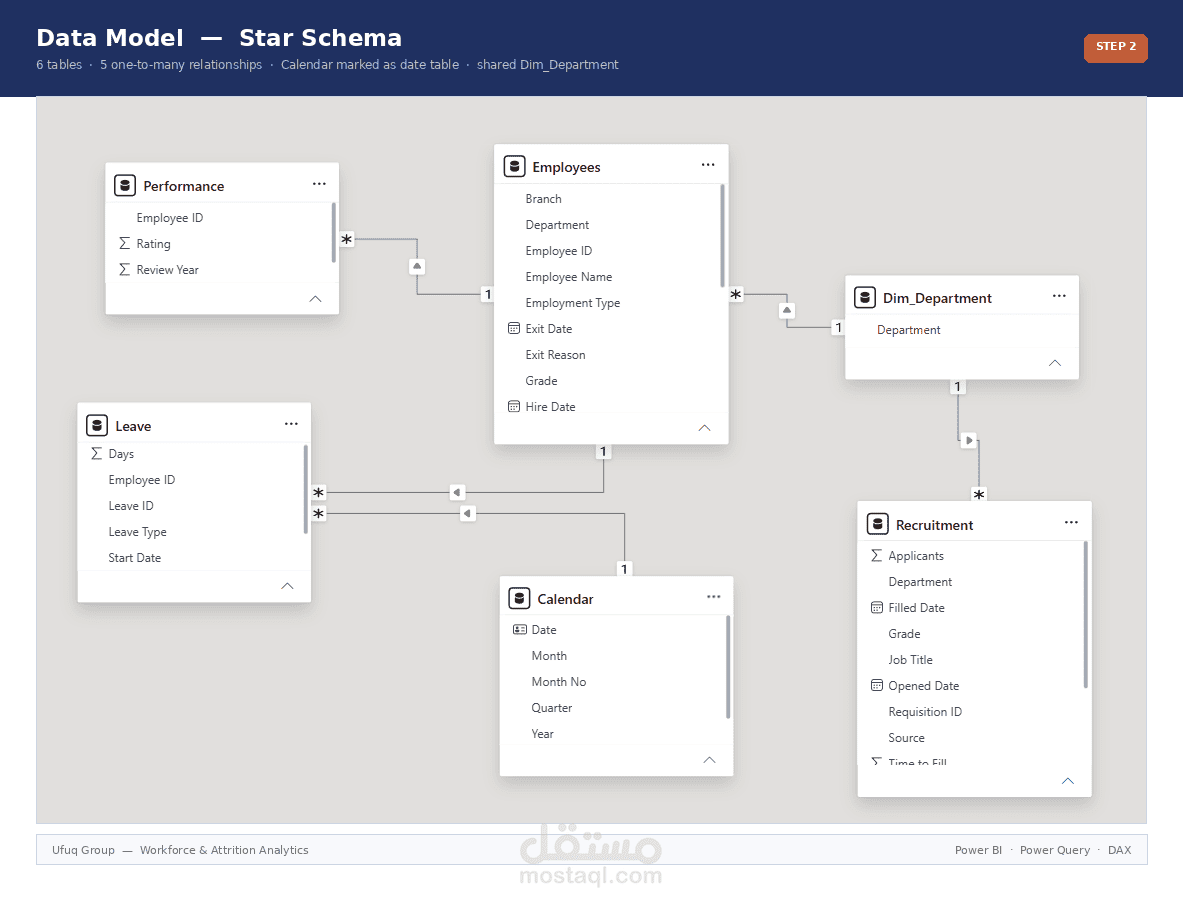
- Built a star-schema data model with 6 tables, a Calendar table
created in DAX, and a shared Department dimension.
- Wrote 15 DAX measures including a point-in-time headcount measure
that shows how many employees were active on any given date.
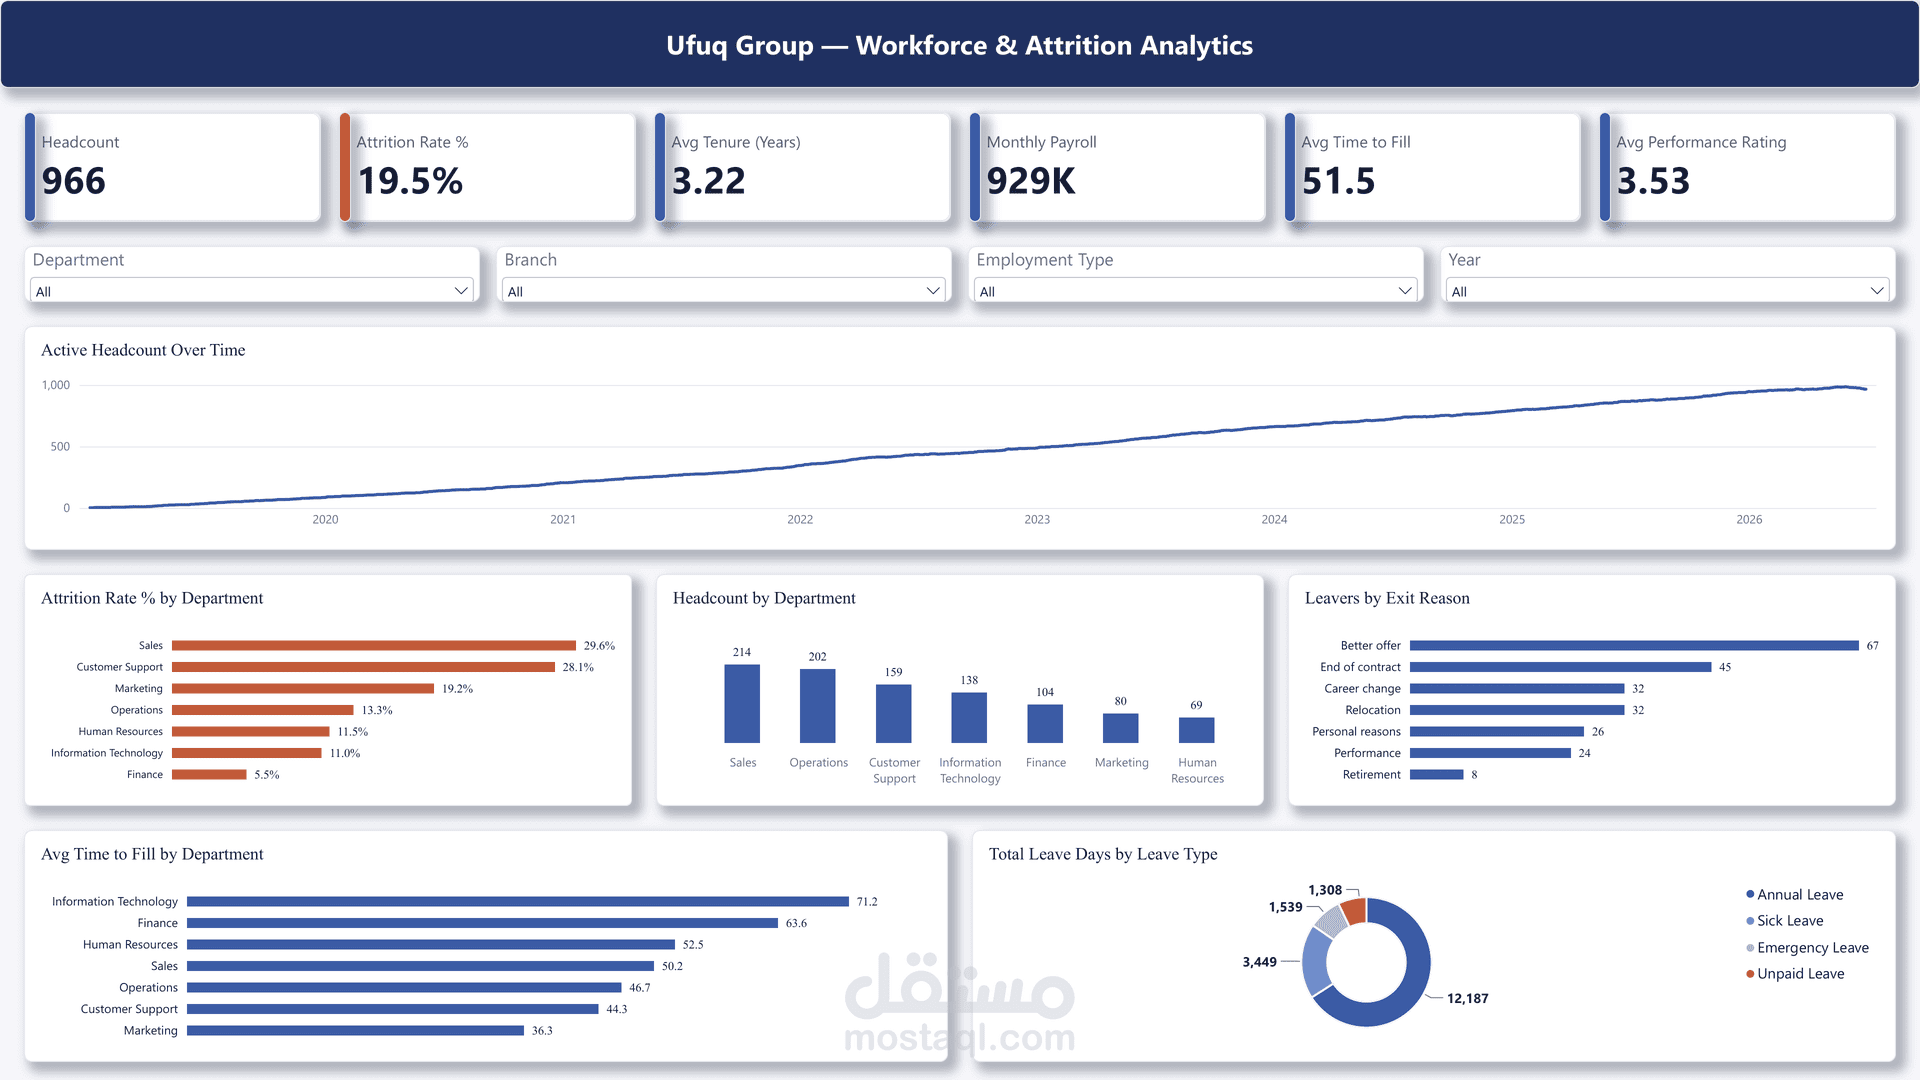
- Designed the dashboard page at 1920x1080 with 6 KPI cards,
6 charts and 4 slicers.
What the dashboard answers:
- How the workforce grew month by month from 2019 to 2026
- Which departments lose the most people (Sales 29.6%, Customer
Support 28.1%) and why
- How long it takes to fill a position in each department
- How leave days are split across leave types
Tools: Power BI Desktop, Power Query (M), DAX, Data Modeling, Excel