Interactive Sales Dashboard in Excel Power Query Data Model and DAX
تفاصيل العمل
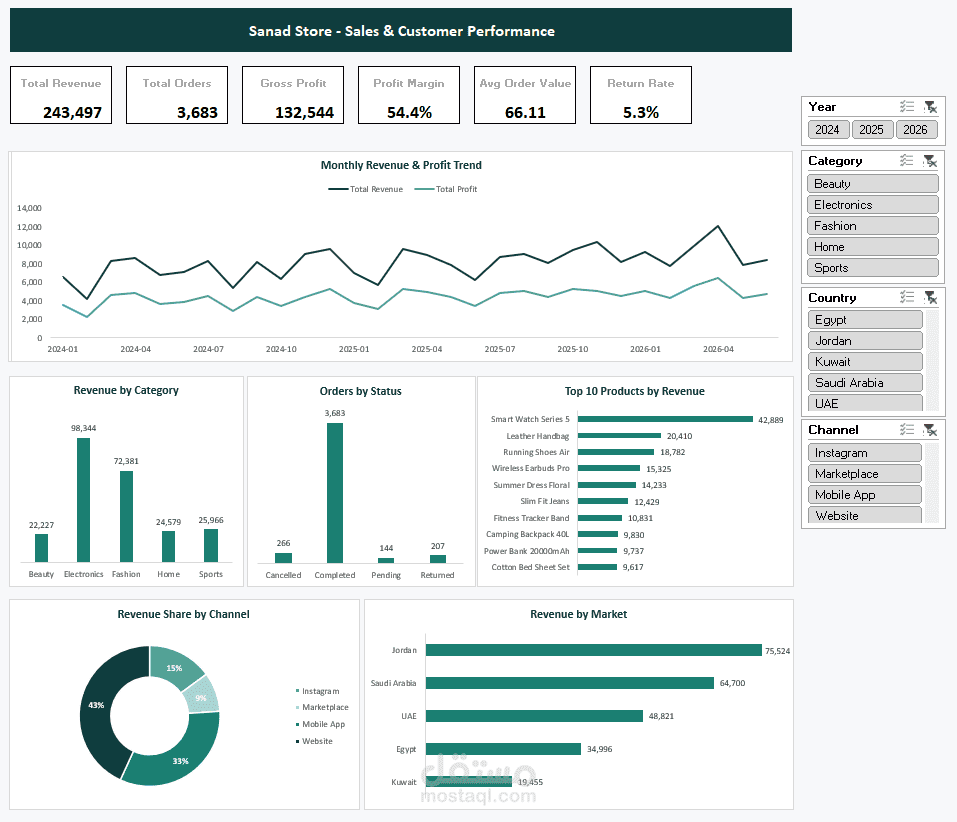
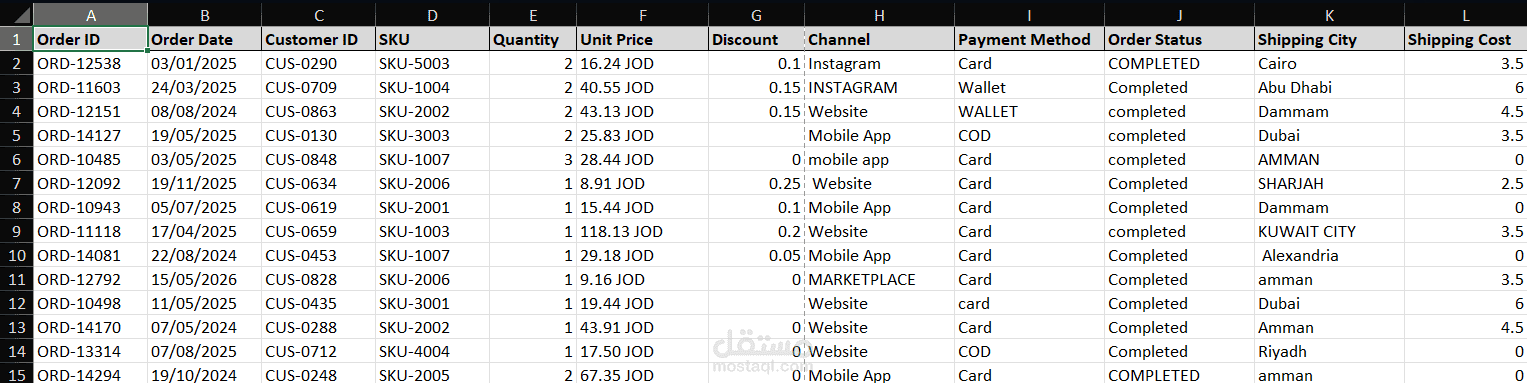
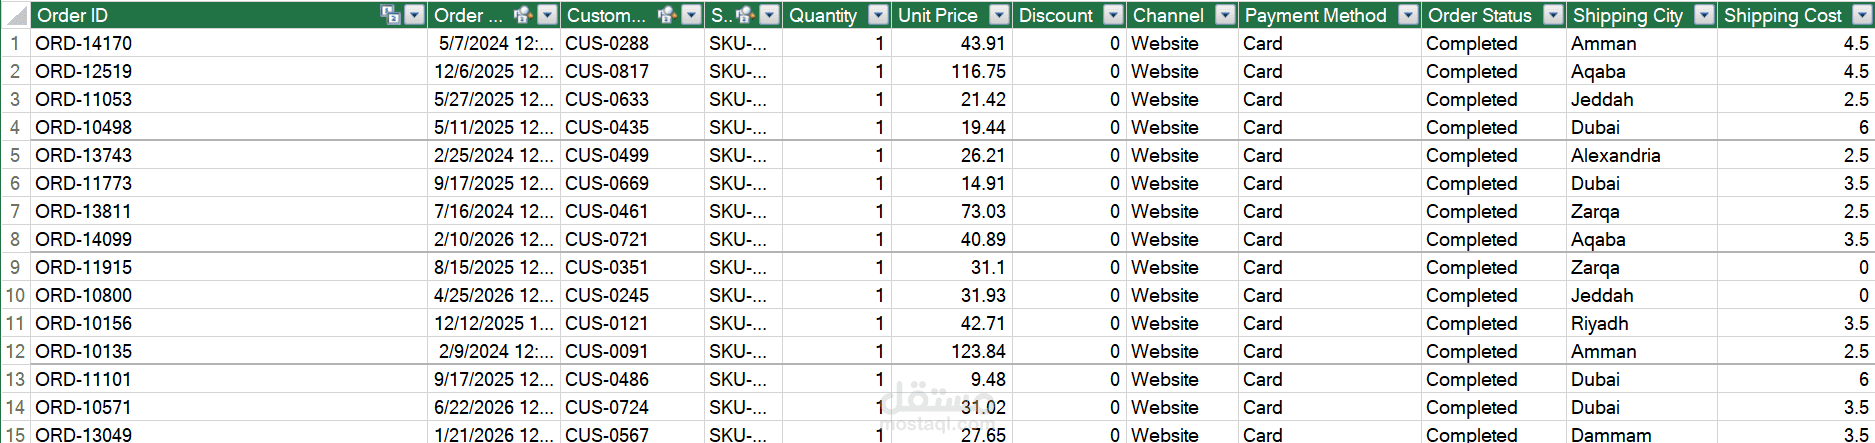

I built this dashboard in Excel to practise a full data analysis project, from a messy raw file to a finished report.
The data is a sample e-commerce dataset: 4,300 orders from five countries, between January 2024 and June 2026.
The raw file was messy on purpose. It had 130 duplicate rows, dates saved as text instead of dates, prices written like "45.00 JOD" instead of numbers, 61 empty quantities, 37 negative ones, and columns where the same value was written in different ways (Website, website, WEBSITE).
I cleaned all of it in Power Query, step by step. Every step is saved in the file, so if new data comes in I just press Refresh and everything updates by itself.
Then I connected the tables together — orders, products, customers, returns, and a calendar table — and wrote 11 measures in DAX: revenue, profit, profit margin, average order value, return rate, and growth compared to the same period last year.
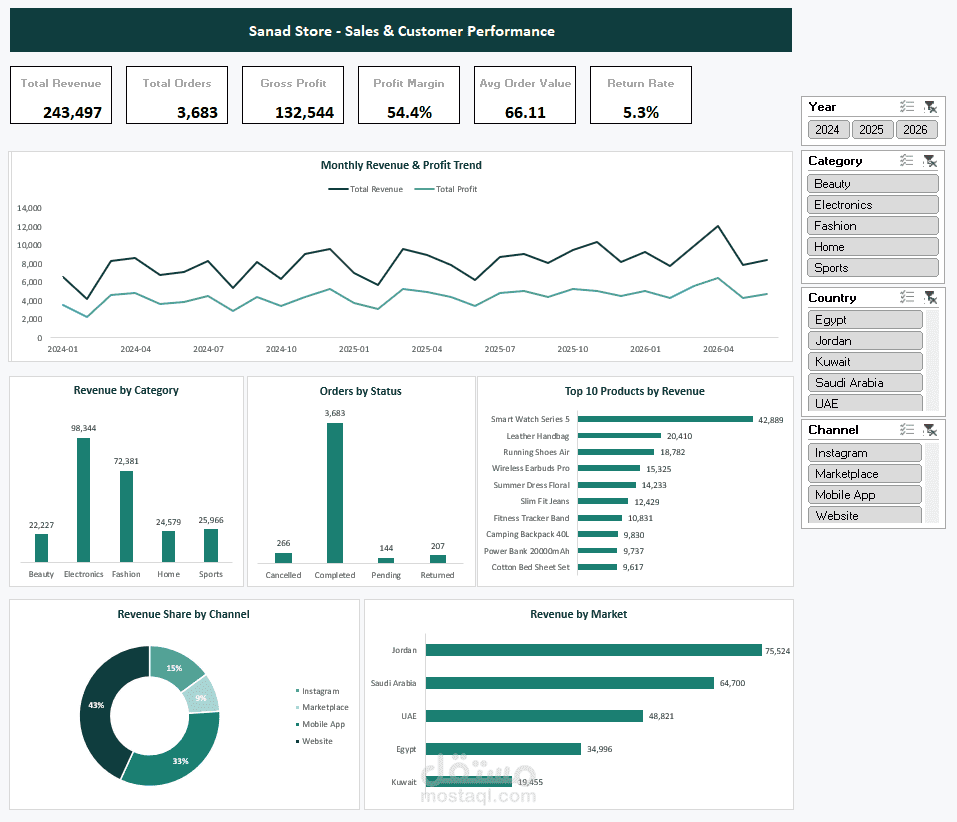
The final dashboard is one screen with 6 KPI cards and 6 charts. There are 4 filters, and clicking any of them updates the whole screen at once.
I also added two extra sheets inside the file. One lists every cleaning step I did and why. The other explains every column and every formula.
Note: this is a practice project on sample data, not real client work. I built it to show how I work and what I can do.