Data set and Pivot table
تفاصيل العمل
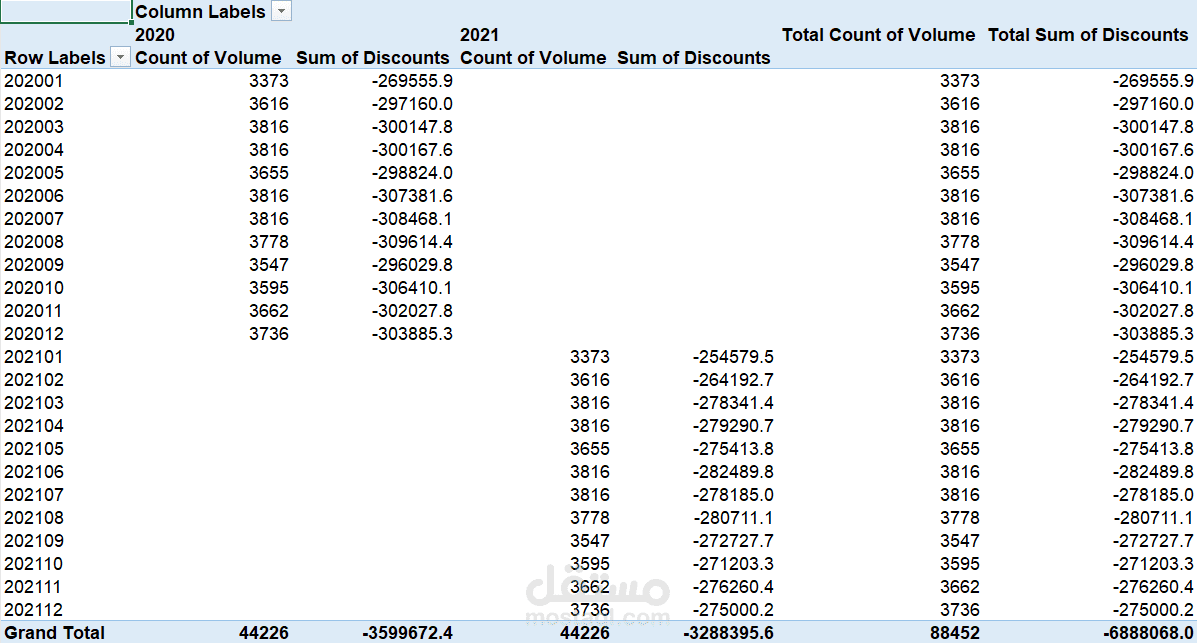
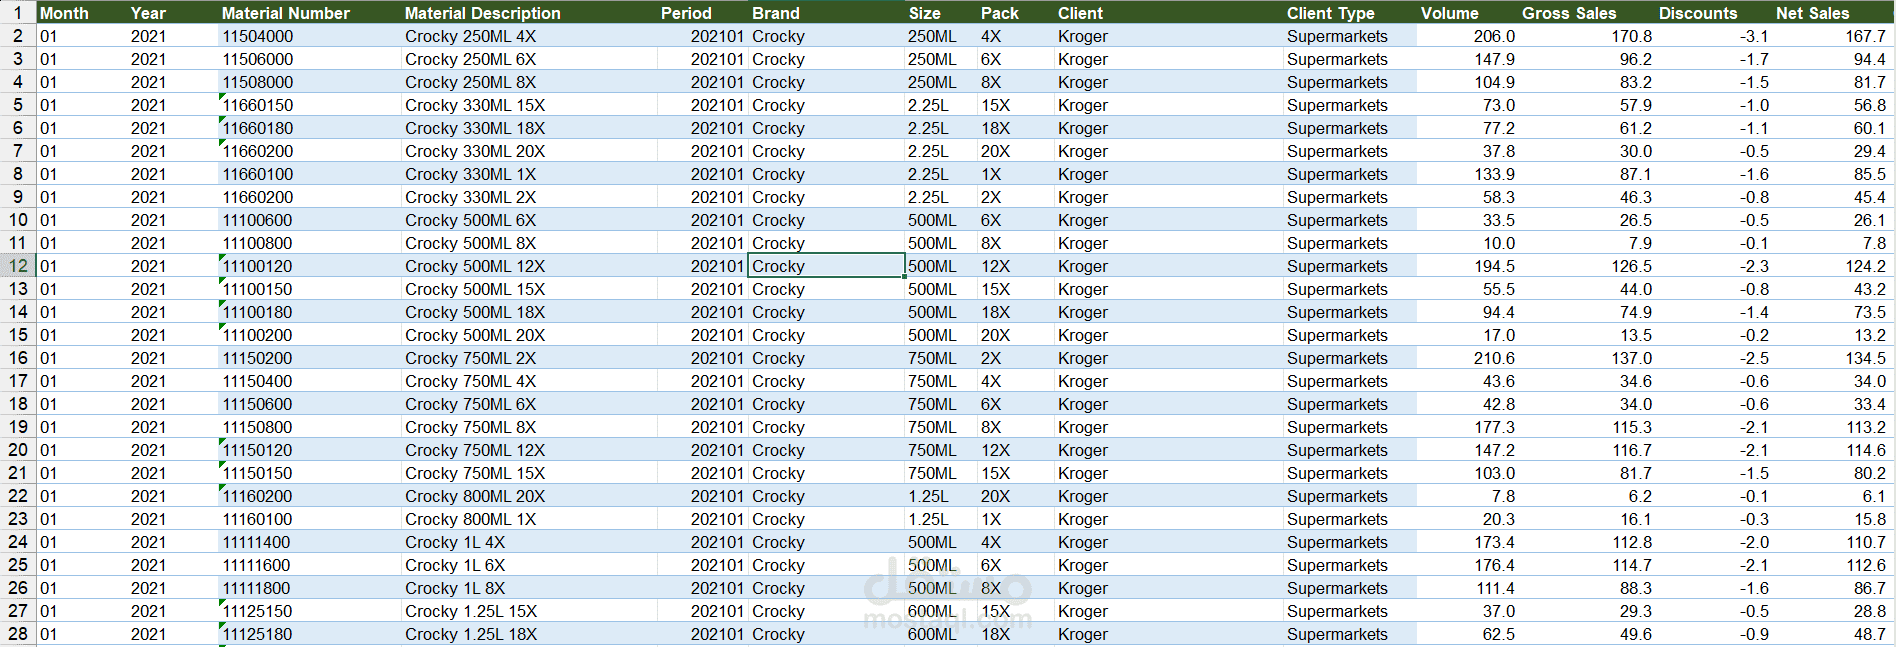
### Data Analysis and Pivot Table Dashboard in Excel
This project demonstrates my ability to organize, analyze, and summarize a large dataset using **Microsoft Excel**.
I used Excel to structure the data, perform data analysis, and create **Pivot Tables** to transform raw data into clear and meaningful summaries. The project focuses on extracting useful insights, identifying patterns, and presenting information in an organized format.
**Key Skills Demonstrated:**
* Microsoft Excel
* Data Cleaning and Organization
* Data Analysis
* Pivot Tables
* Data Summarization
* Filtering and Categorization
* Financial & Business Data Analysis
* Creating Clear and Structured Reports
This project demonstrates my ability to turn raw datasets into organized analytical reports that can support **business decision-making and performance analysis**.