Excel dashboard
تفاصيل العمل
started by importing the dataset and performing Data Cleaning, which included:
Removing duplicates
Correcting data types
Removing extra spaces
Handling missing values
Creating a new Score Status column
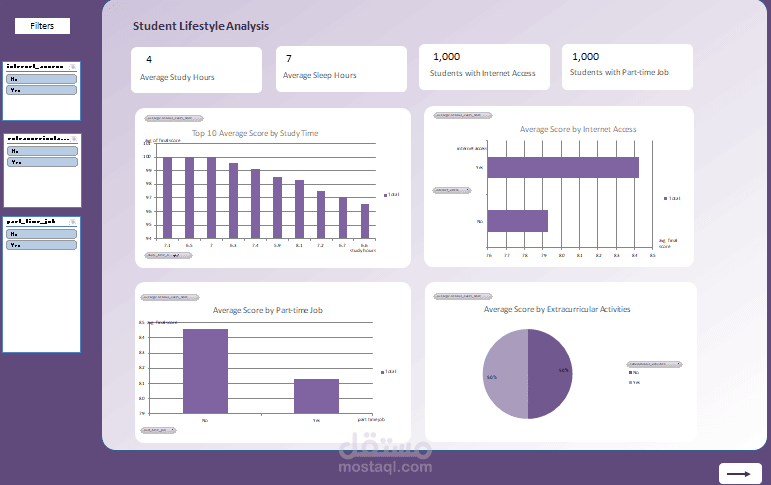
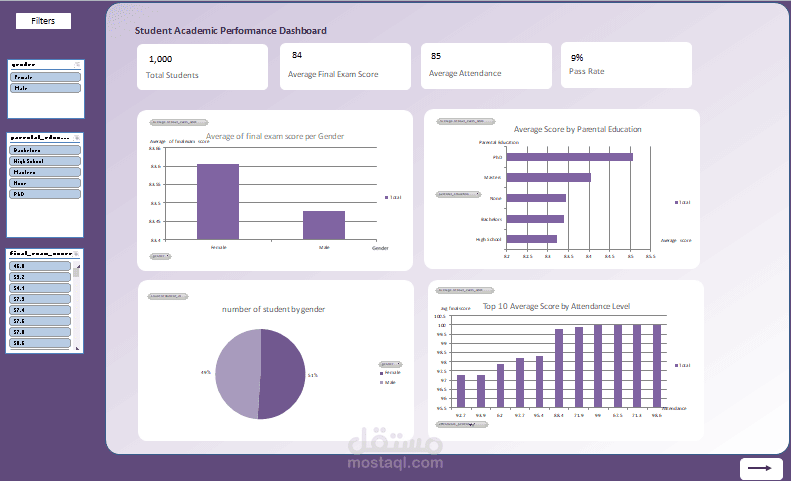
After preparing the data, we created Pivot Tables and Pivot Charts to extract valuable insights, then designed an Interactive Dashboard using Microsoft Excel.
In the dashboard, I used:
KPI Cards to display:
Total Students
Average Final Exam Score
Average Attendance
Pass Rate
Slicers for interactive data filtering
Bar Chart
Column Chart
Pie Chart