healthcare
تفاصيل العمل
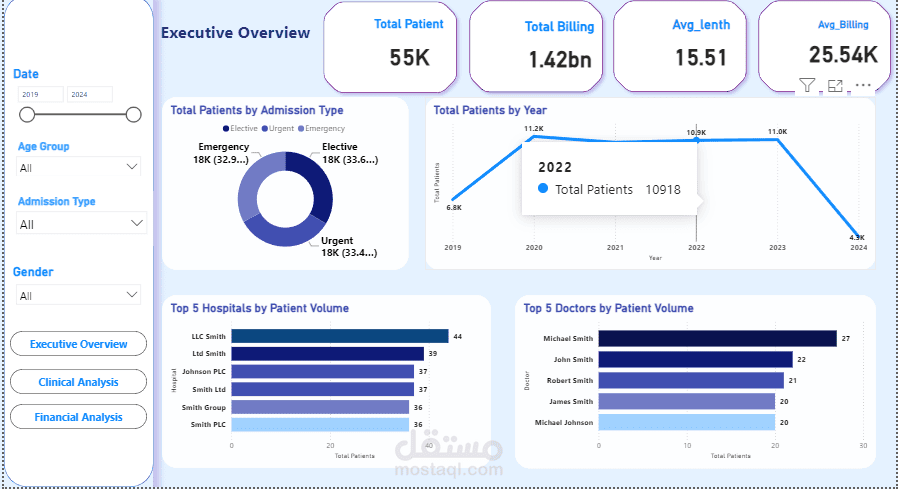
Built an interactive Power BI dashboard to track hospital ward performance, bed occupancy, and resource allocation in real time. The goal was to turn scattered operational data (bed occupancy, patient admission/discharge rates, resource distribution across wards) into a single view that helps decision-makers spot bottlenecks and improve operational efficiency.
Key highlights:
Built a structured data model connecting patient, ward, and bed tables
Used DAX to calculate KPIs including occupancy rate, average length of stay, and turnover rate
Designed an interactive dashboard with dynamic filters (by ward, time period, case type)
Converted raw operational data into a decision-ready report, removing the need for manual analysis
Outcome: A ready-to-use dashboard giving an instant view of occupancy and resource status, enabling faster operational decisions.