Excel Dashboard
تفاصيل العمل
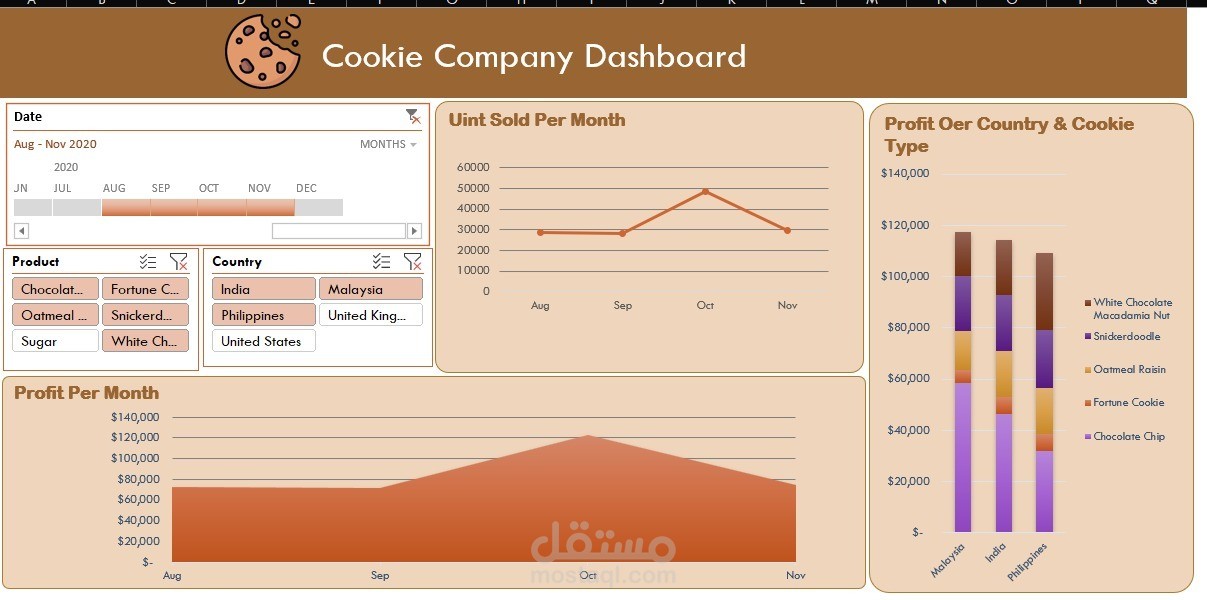
Cookie Company Dashboard
This project focuses on analyzing the sales performance of a cookie company. The dataset contains information about dates, products, countries, units sold, sales, and profit.
The main challenge was that the raw data did not provide a quick and clear overview of the company’s performance. It was difficult to compare monthly performance, products, and countries manually.
As a Data Analyst, I organized and analyzed the data based on time, product, and country. I analyzed units sold and profit over different months and compared the contribution of different cookie types across countries.
Then, I created an interactive Excel dashboard using charts and filters to make the analysis easier to understand and explore.
The dashboard allows users to monitor monthly performance, compare countries and products, and analyze profit distribution.
The main benefit of the dashboard is that it transforms raw sales data into clear business insights and makes it easier to monitor performance and support data-driven decisions.”
“Through this project, I learned how to transform raw business data into an interactive dashboard that provides clear insights into sales and profitability.”