Computer Sales & Business Performance Dashboard
تفاصيل العمل
Computer Sales & Business Performance Dashboard
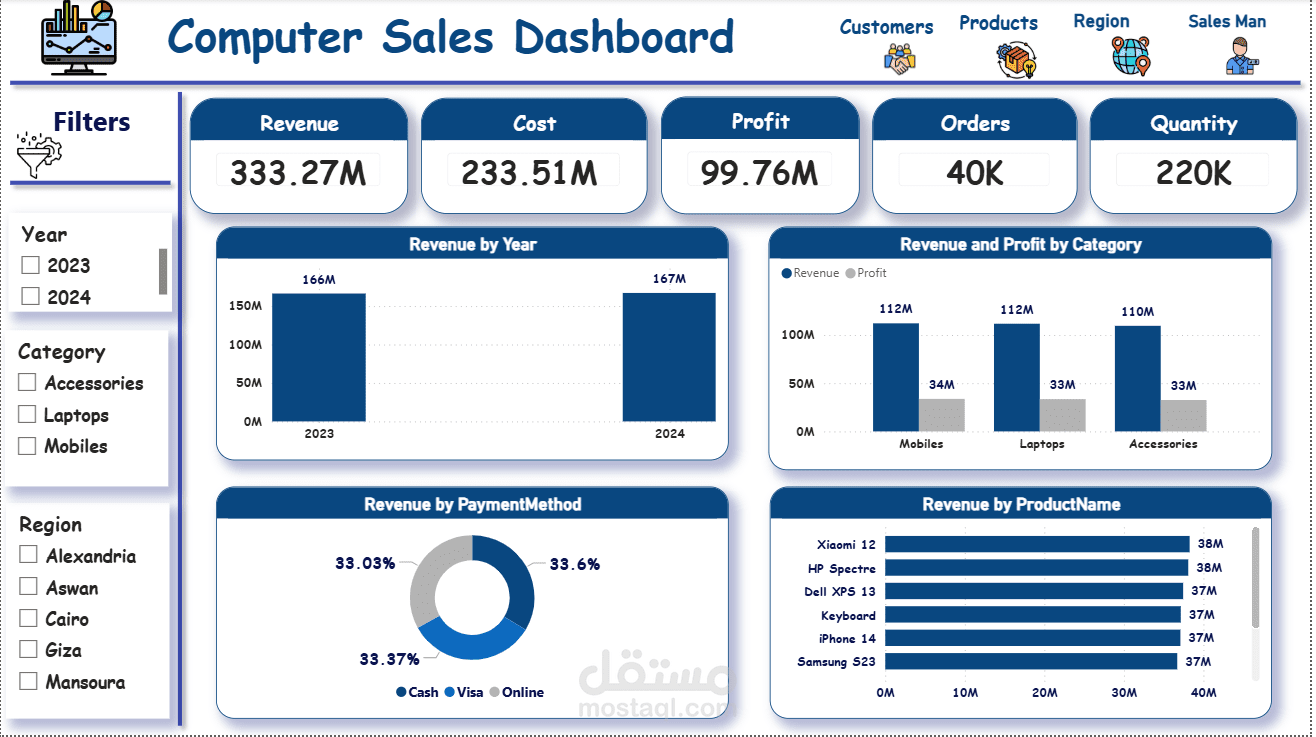
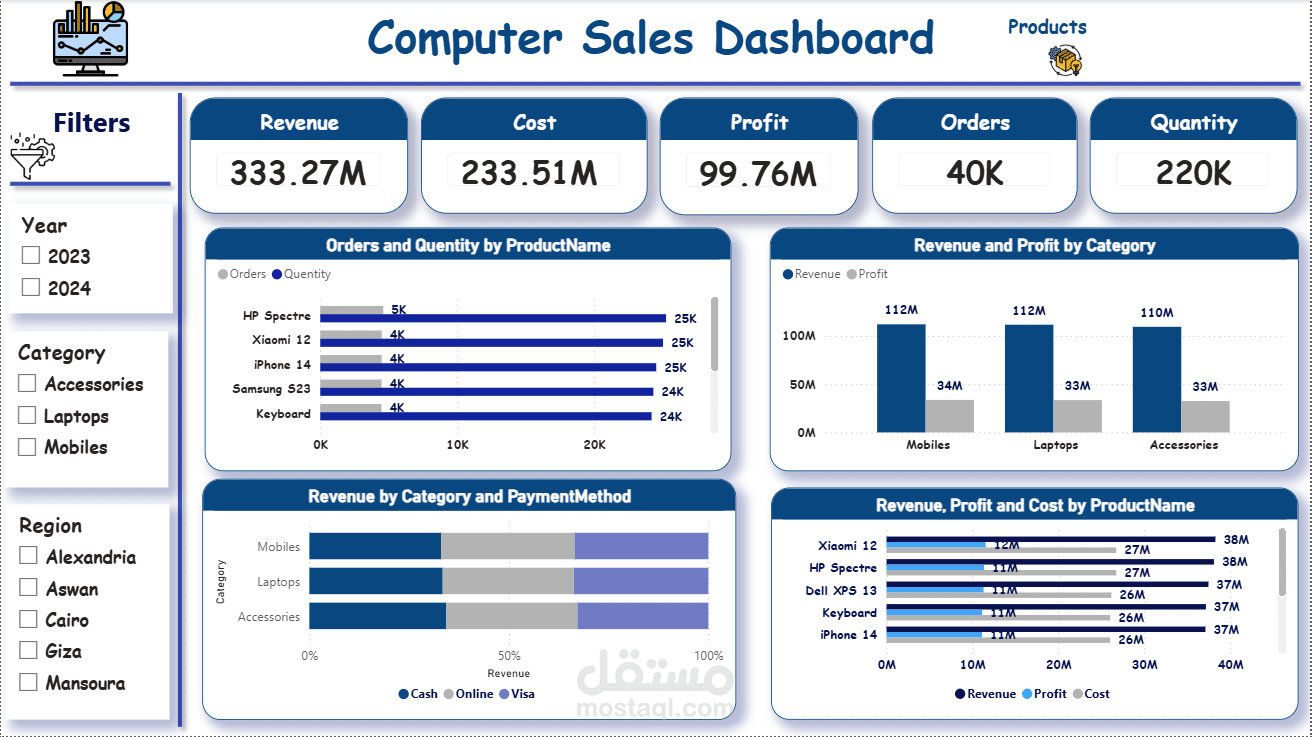
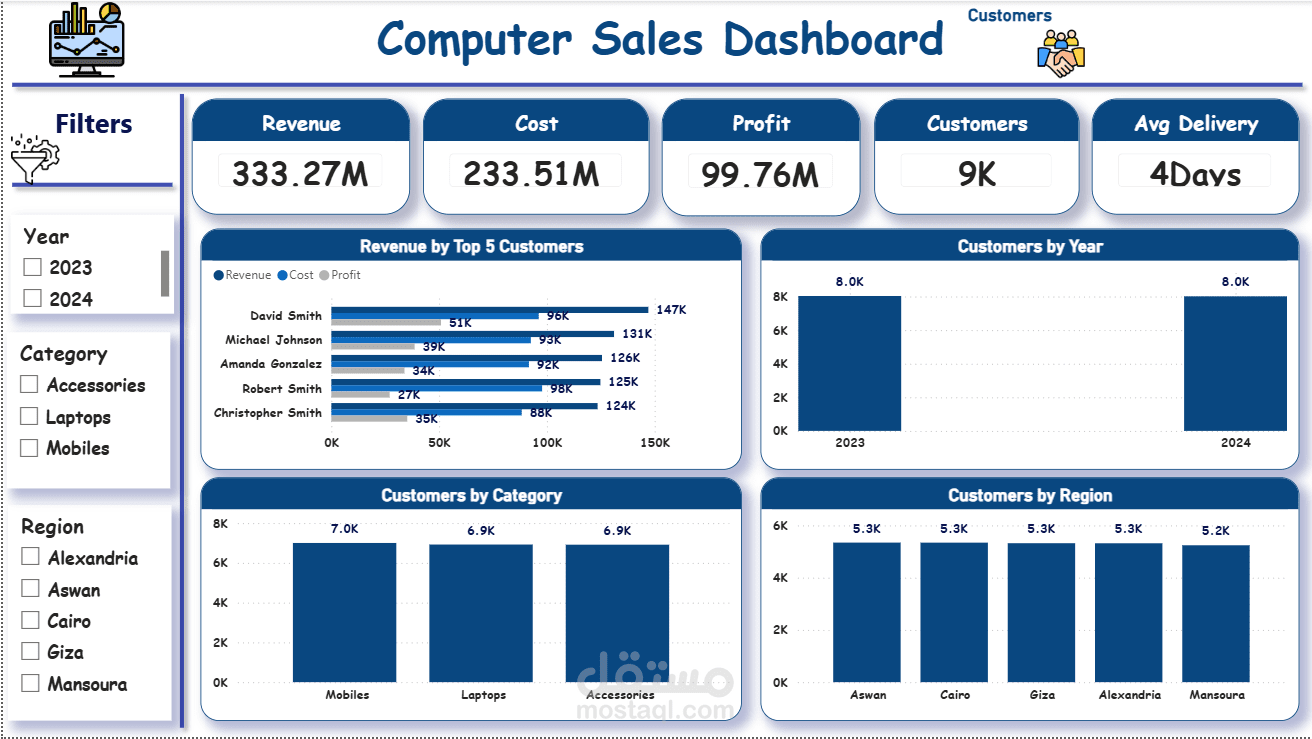
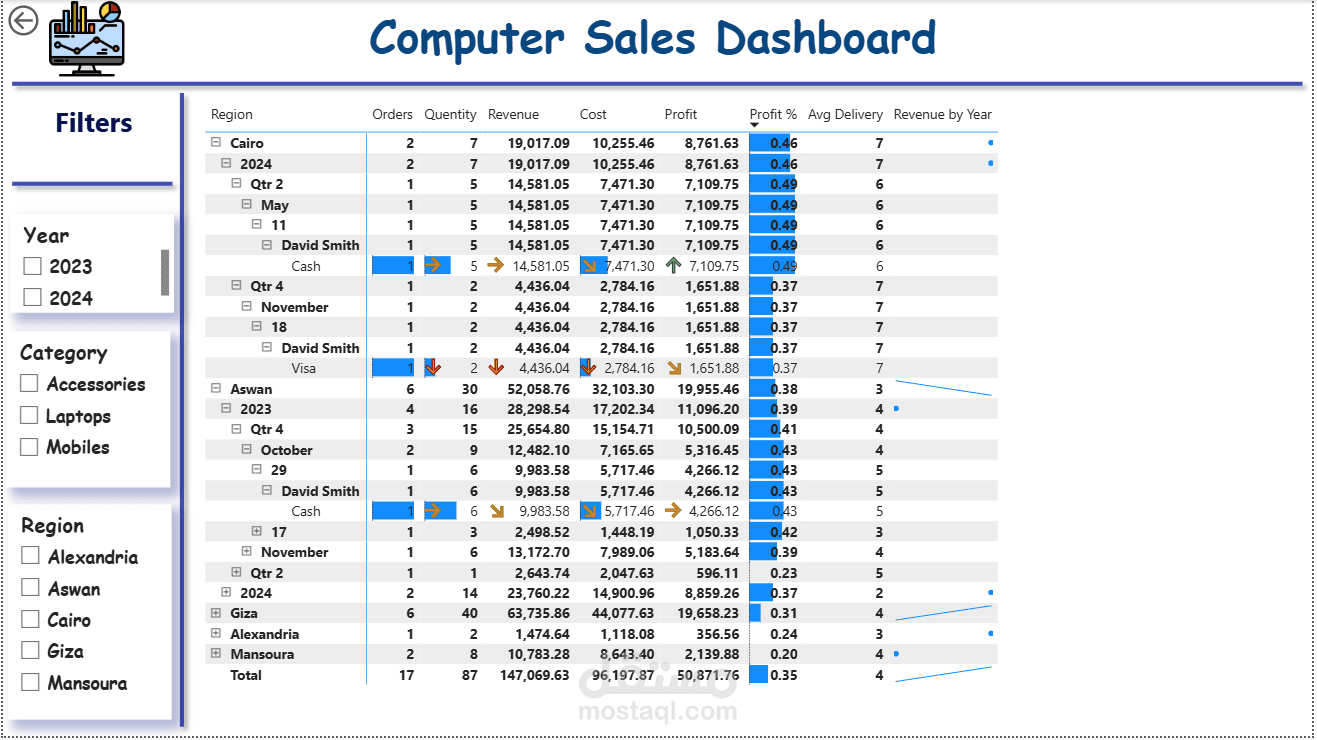
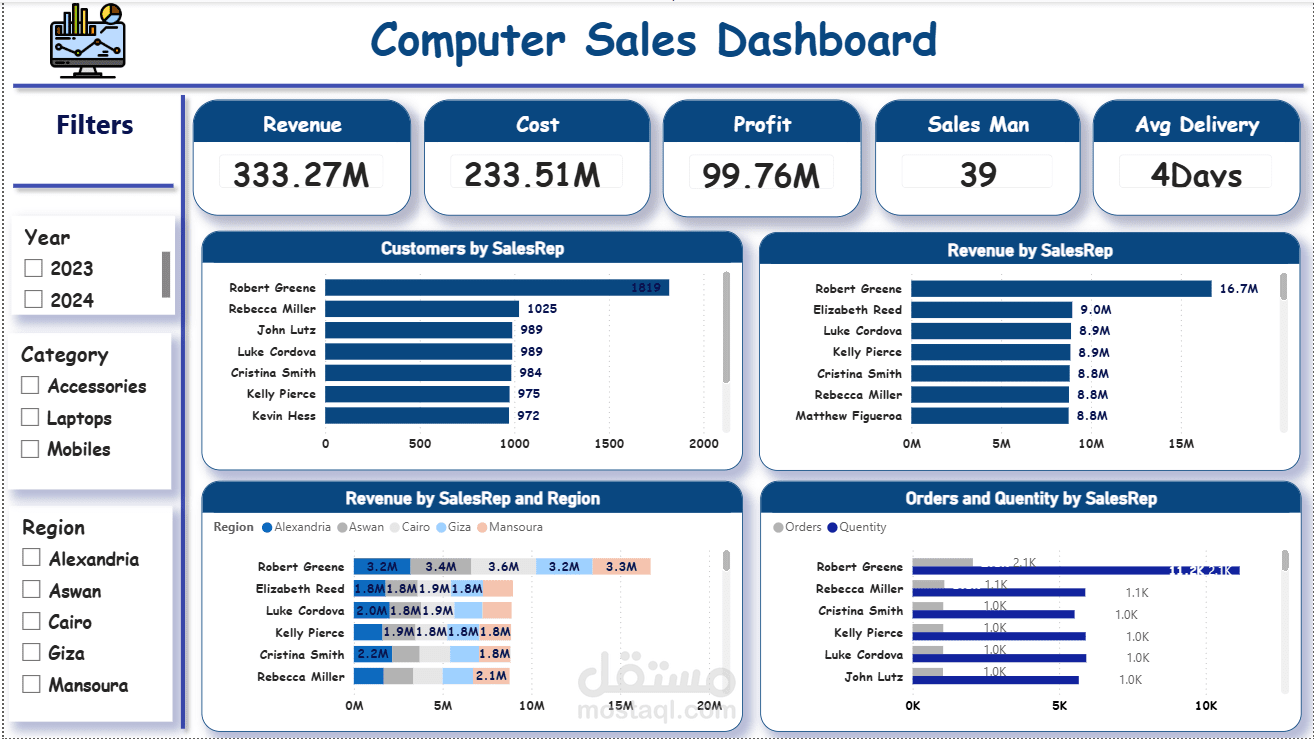
Developed an interactive Power BI dashboard to analyze computer sales performance, revenue, profitability
, customers, products, regions, and sales representatives.
Key Analysis Areas:
- Revenue, cost, and profit performance
- Sales and revenue trends by year
- Revenue and profit analysis by product category
- Product performance and top-selling products
- Customer analysis and top customers by revenue
- Customer distribution by year, category, and region
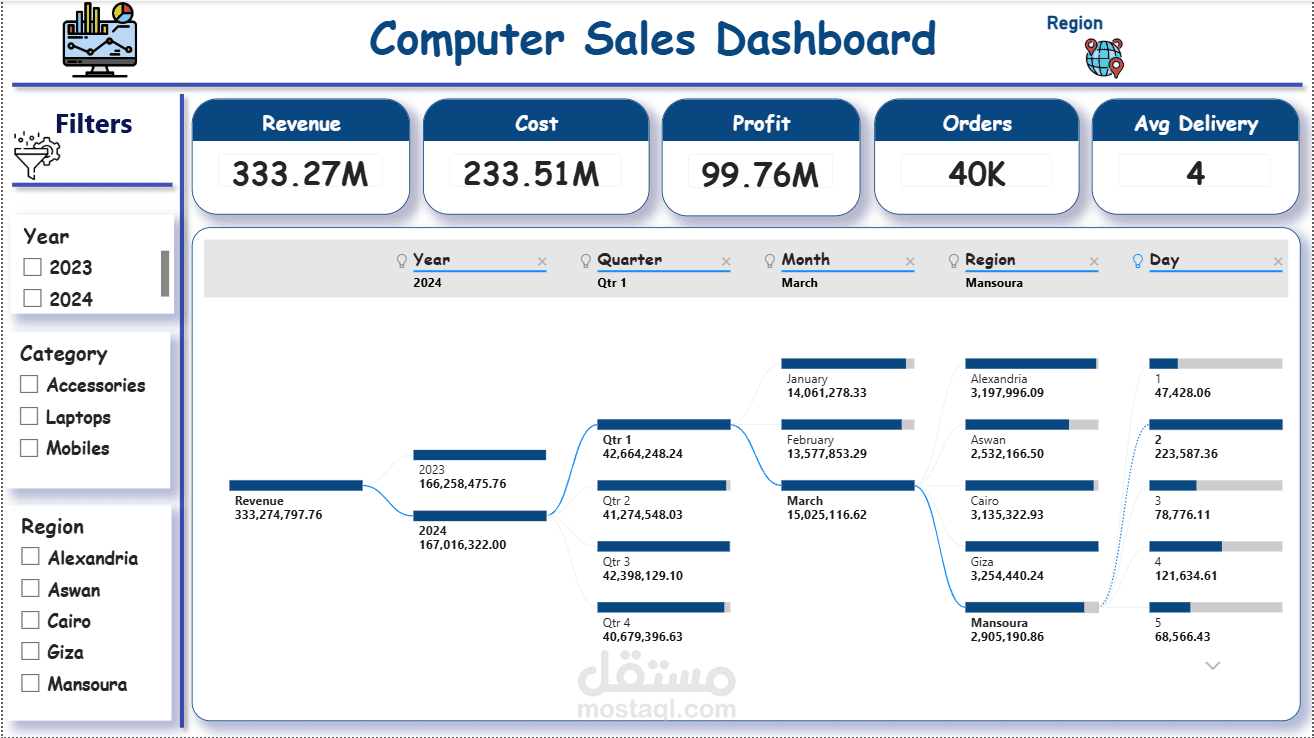
- Regional sales performance
- Payment method analysis
- Sales representative performance
- Interactive filtering by year, category, and region
Key KPIs:
Revenue, Cost, Profit, Orders, Quantity, Customers, and Average Delivery Time.
Tools Used:
Power BI, DAX, Power Query, Data Analysis & Data Visualization.
The dashboard converts raw sales data into interactive business insights to support data-driven sales and commercial decisions