Super Store Sales & Dashboard-Power BI
تفاصيل العمل
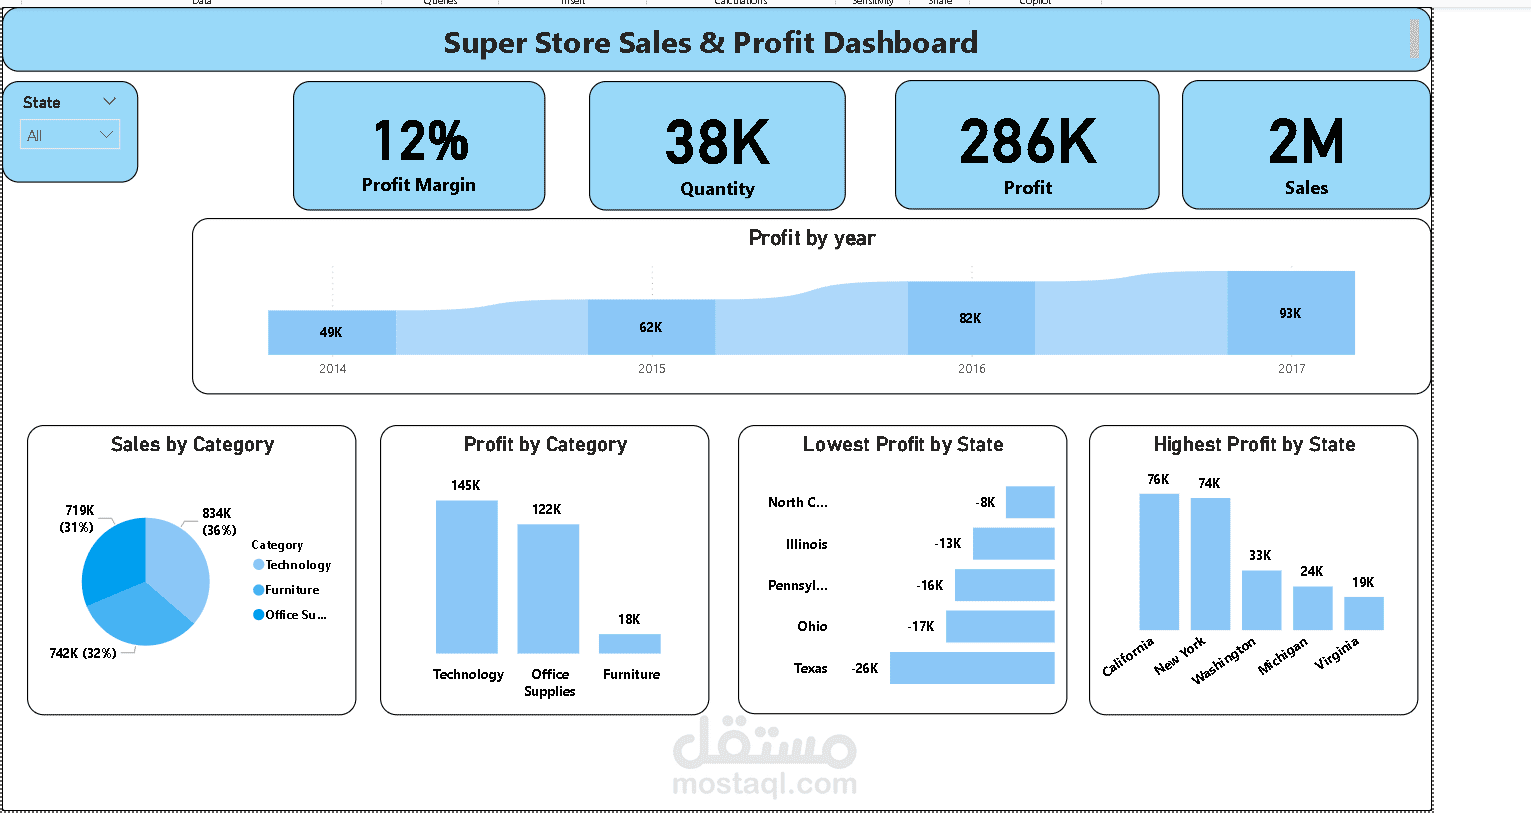
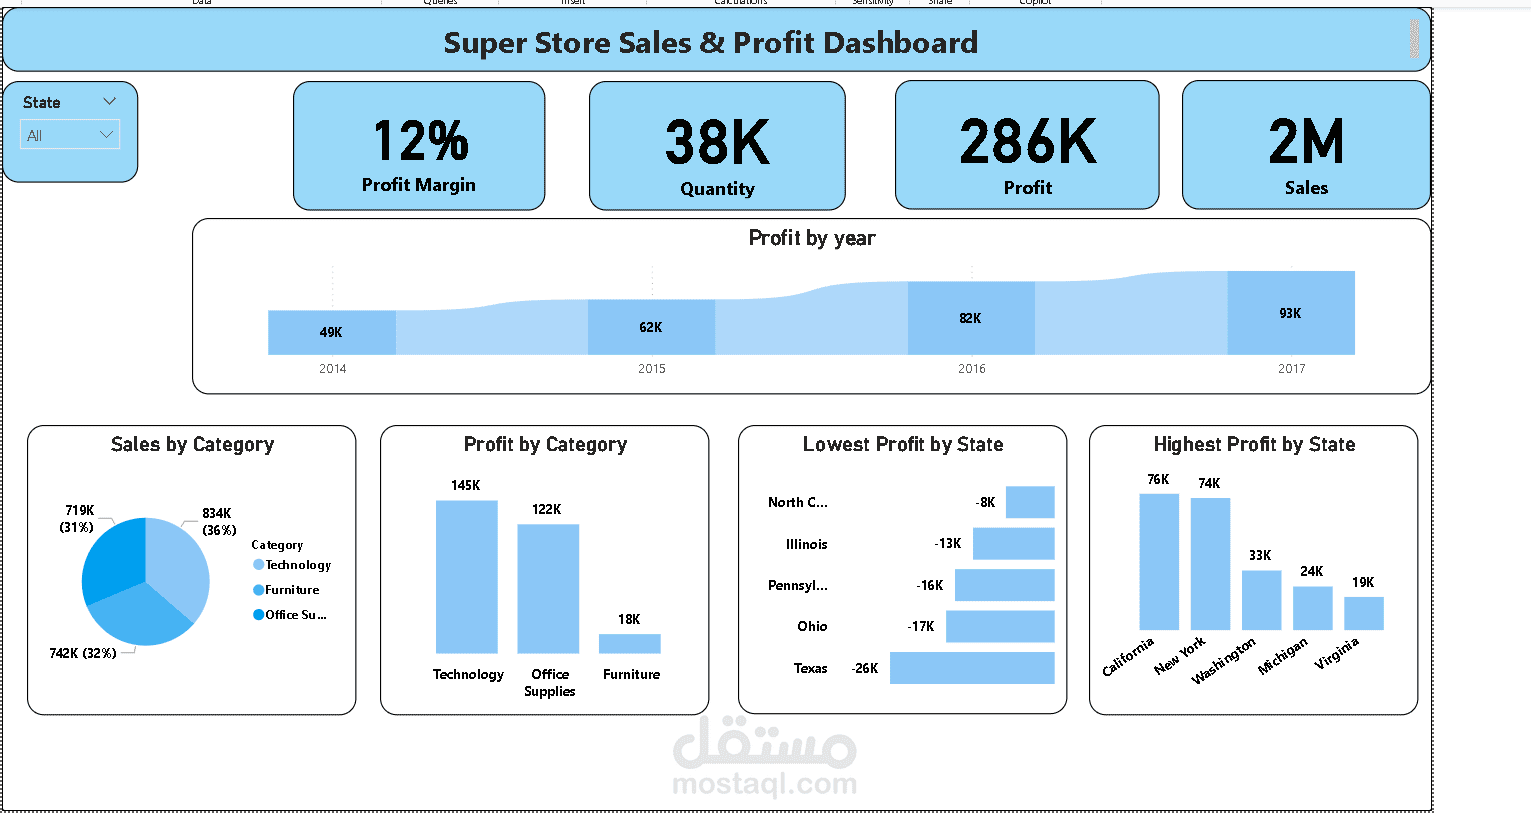
Super Store Sales & Profit Dashboard created using Power BI. The dashboard provides an interactive overview of sales and profitability, including Profit Margin, Total Sales, Profit, Quantity, yearly profit trends, sales by category, and the
highest and lowest profitable state
The dashboard also includes interactive filters to help users explore the data and gain useful business insights