Sales Performance & Regional Analysis Dashboard
تفاصيل العمل
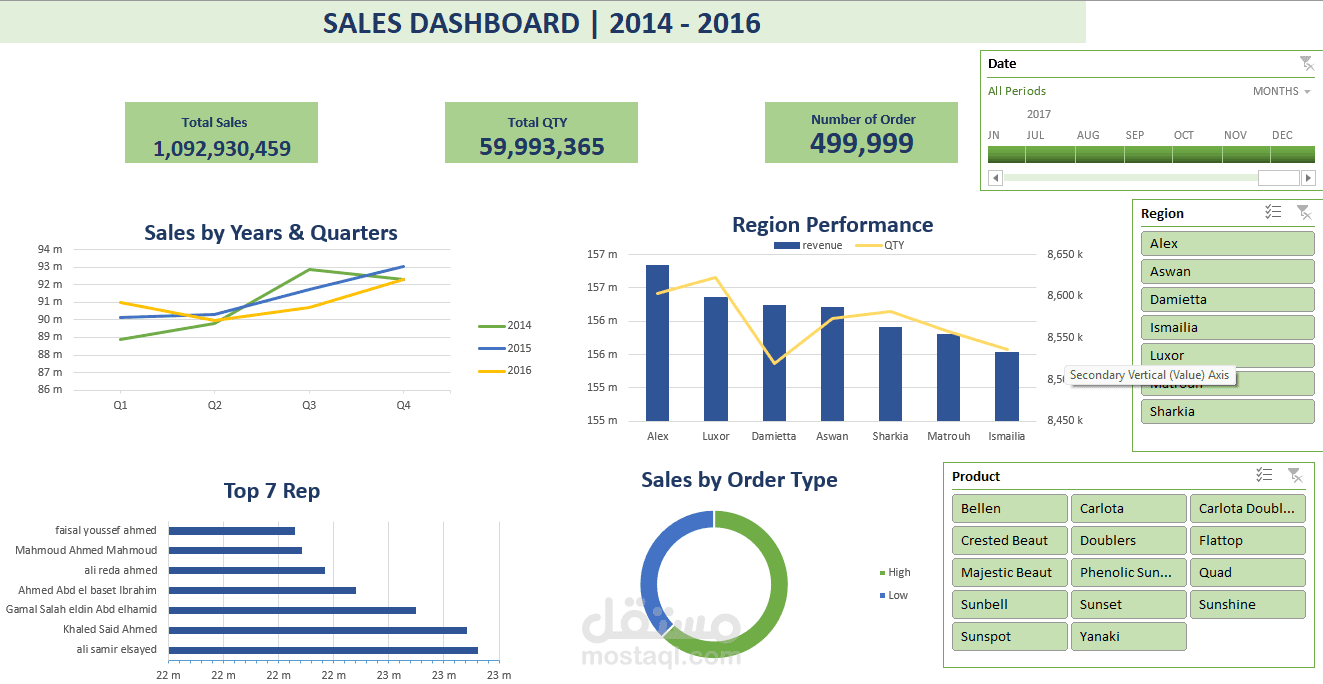
Created an interactive sales dashboard for analyzing sales performance across different years, quarters, regions, products, and sales representatives.
The dashboard provides multiple views of sales performance and allows users to explore the data through interactive filters.
Key features:
Total Sales
Total Quantity
Number of Orders
Sales by Year & Quarter
Regional Performance
Sales by Order Type
Top Sales Representatives
Product-level analysis
Interactive date, region, and product filters
The dashboard focuses on identifying regional trends, top performers, sales patterns, and business opportunities.