Sales & Profit Performance Dashboard Selas& Profit performanceDashboard
تفاصيل العمل
📊 Key Insights – Sales Performance Dashboard
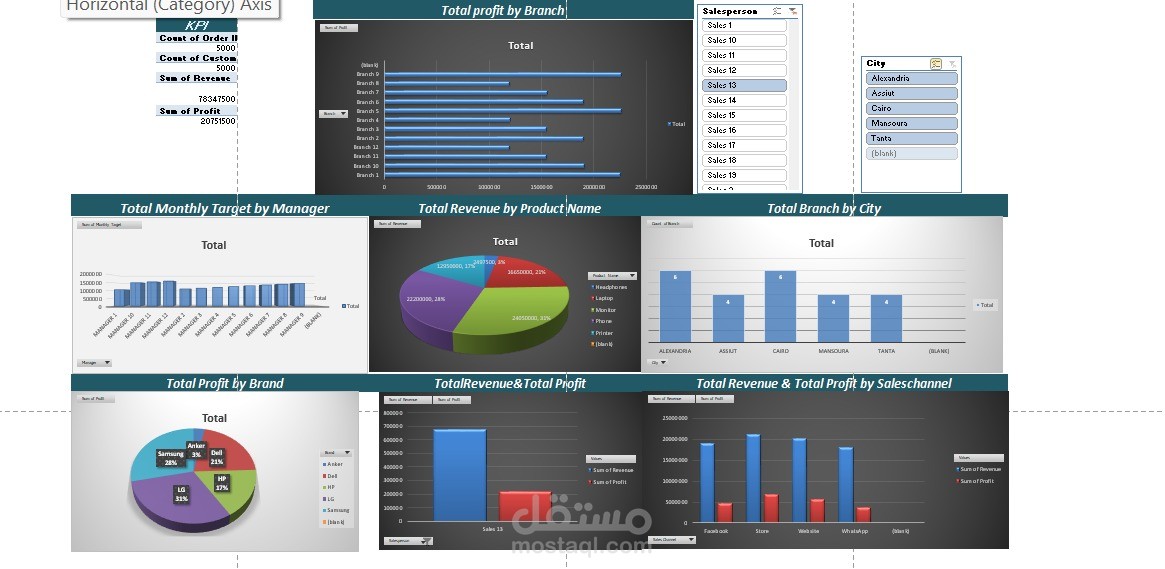
The performance indicators show a total of 5,000 orders, with approximately 78.35 million in revenue and 20.75 million in profit.
LG leads total profit with approximately 31%, followed by Samsung at 28% and Dell at 21%.
Cairo and Alexandria recorded the highest number of branches, with 6 branches each.
Total profit varies across branches, with some branches performing better than others, indicating differences in operational performance.
Revenue and profit vary across sales channels, with Store being one of the highest-performing channels.
There are noticeable differences in monthly targets among managers, allowing management to compare performance against targets.
Product revenues vary, indicating that some products contribute more significantly to overall revenue than others.
Overall, the dashboard reflects strong revenue and profit performance, with noticeable variations across branches, products, and sales channels.
📊 أهم الاستنتاجات – Sales Performance Dashboard
تُظهر مؤشرات الأداء إجمالي 5,000 طلب، مع إيرادات تقارب 78.35 مليون وأرباح تصل إلى حوالي 20.75 مليون.
تتصدر LG إجمالي الأرباح بنسبة تقارب 31%، تليها Samsung بنسبة 28% وDell بنسبة 21%.
سجلت القاهرة والإسكندرية أعلى عدد من الفروع، بواقع 6 فروع لكل مدينة.
يختلف إجمالي الربح بين الفروع، مع وجود فروع تحقق أداءً أعلى من غيرها، مما يشير إلى تفاوت في الأداء التشغيلي.
تختلف الإيرادات والأرباح حسب قنوات البيع، مع تفوق Store كإحدى القنوات الأعلى أداءً.
تظهر اختلافات واضحة في الأهداف الشهرية للمديرين، مما يساعد على مقارنة أداء المديرين مقابل أهدافهم.
توجد فروقات في إيرادات المنتجات، مما يوضح أن بعض المنتجات تساهم بشكل أكبر في إجمالي الإيرادات.
بشكل عام، يعكس الداشبورد أداءً قويًا في الإيرادات والأرباح مع تفاوت واضح بين الفروع والمنتجات وقنوات البيع.