E-Commerce & Supply Chain Analytics Dashboard | Power BI
تفاصيل العمل
📝 Project Description
Overview:
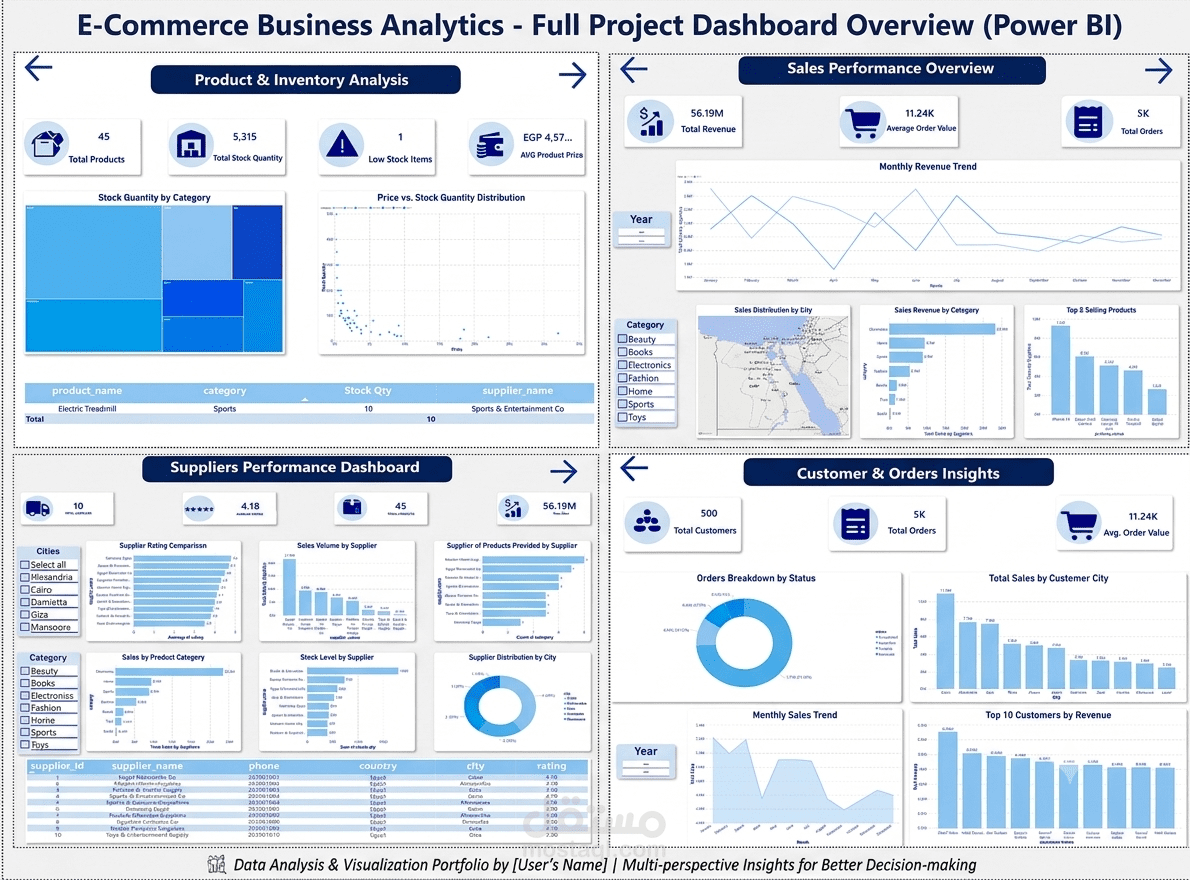
A comprehensive, multi-page Power BI dashboard designed for an E-commerce business to unify and analyze sales performance, inventory health, supplier evaluation, and customer behavior. This interactive tool transforms raw transactional data into actionable insights to drive strategic business decisions.
🛠️ Tech Stack & Key Skills
Power BI: End-to-end interactive dashboard design and page navigation.
SQL: Relational database querying, data extraction, and schema structure.
DAX: Custom measures, dynamic aggregated KPIs, and advanced analytics calculations.
Data Modeling & ETL: Data cleaning, transformation, and Star Schema relationship modeling.
📊 Dashboard Structure & Highlights
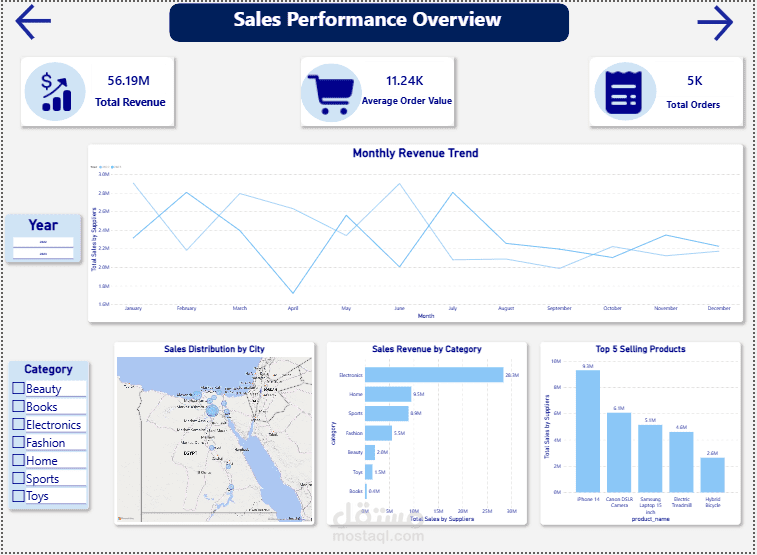
Page 1: Sales Performance Overview
High-level executive KPIs including Total Revenue, Average Order Value (AOV), and Total Orders.
Multi-year Monthly Revenue Trend with dynamic year-over-year slicing.
Geographic sales mapping, product category revenue breakdown, and Top 5 Selling Products.
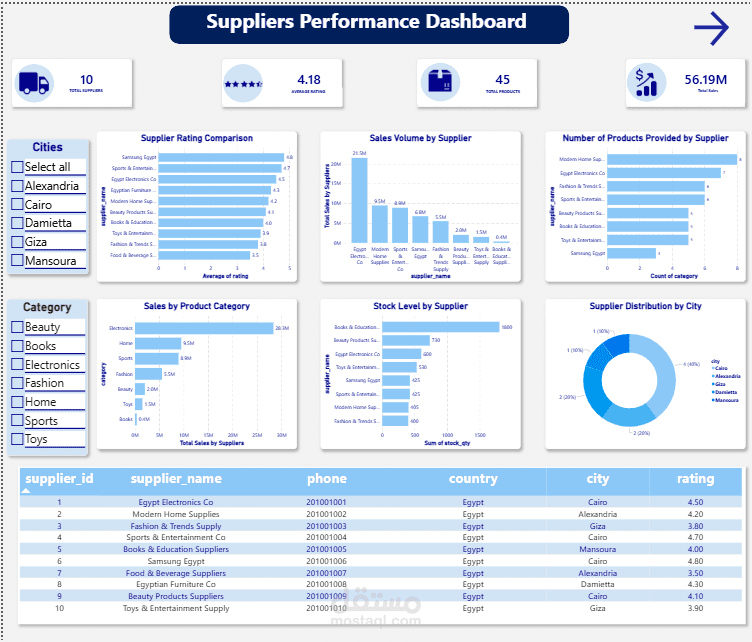
Page 2: Suppliers Performance Dashboard
Supplier rating comparison and distribution across regions.
Sales volume and product volume contribution per supplier.
Stock allocation and inventory levels managed by each vendor.
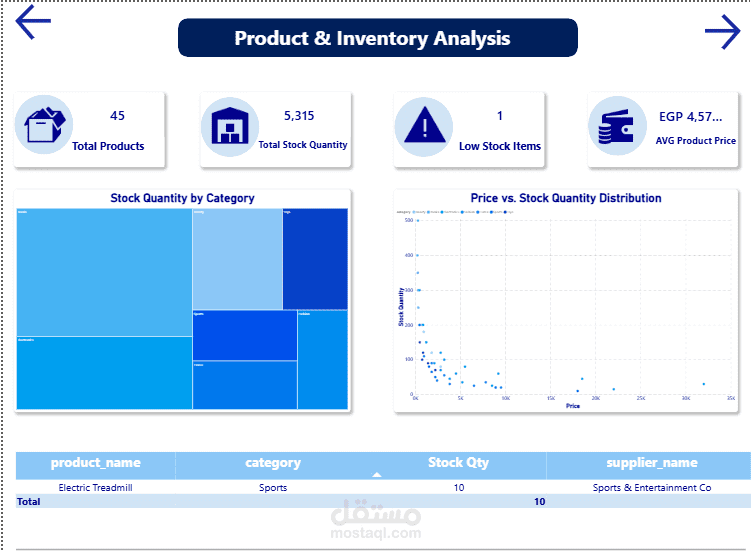
Page 3: Product & Inventory Analysis
Total product catalog and overall stock quantity tracking.
Automated Low-Stock Alert System: A targeted visual table highlighting critical inventory thresholds to prevent stockouts.
Product pricing distribution and category stock volume via Treemap and Scatter Plot visuals.
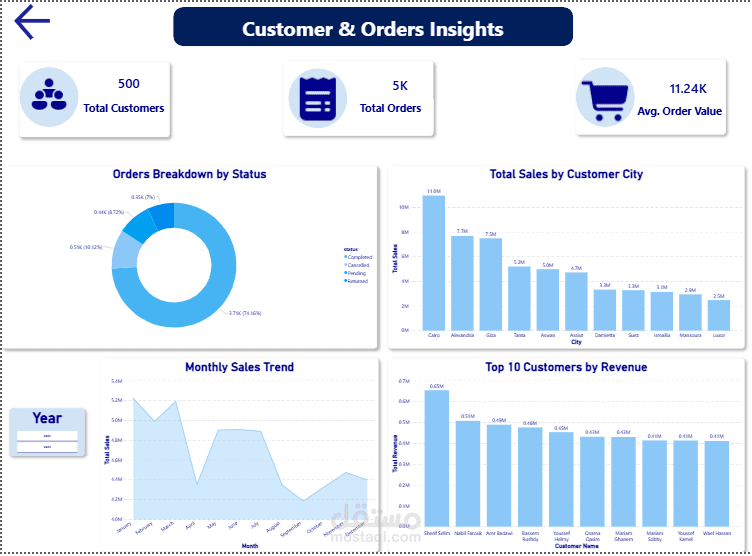
Page 4: Customer & Orders Insights
Active customer base tracking and identification of Top 10 Customers by Revenue.
Order fulfillment breakdown (Completed, Cancelled, Pending, Returned) with exact percentage splits.
Regional revenue analysis across key customer cities and monthly purchasing behavior trends.
🎯 Business Impact & Key Deliverables
Inventory Risk Reduction: Enabled proactive reordering using automated low-stock threshold monitoring.
Targeted Marketing: Identified high-value customer segments and top revenue-generating cities.
User-Centric UX: Seamless navigation via embedded page buttons, interactive slicers, and cross-filtering capabilities across all 4 pages.