Property Finder Real Estate Market Analytics Dashboard | Power BI
تفاصيل العمل
Overview:
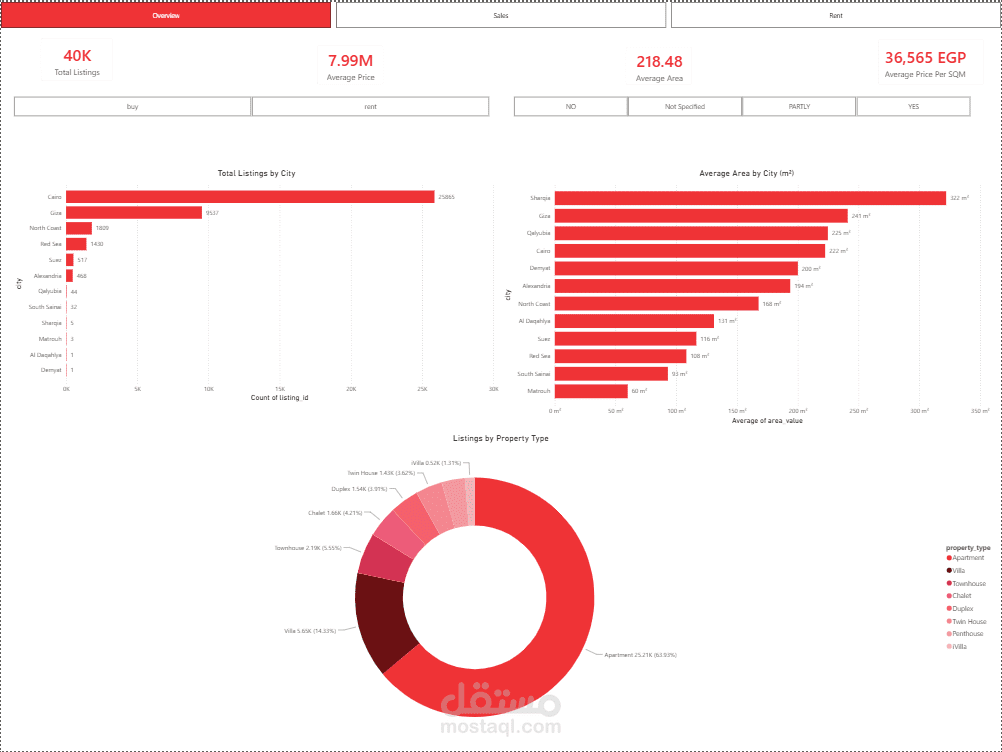
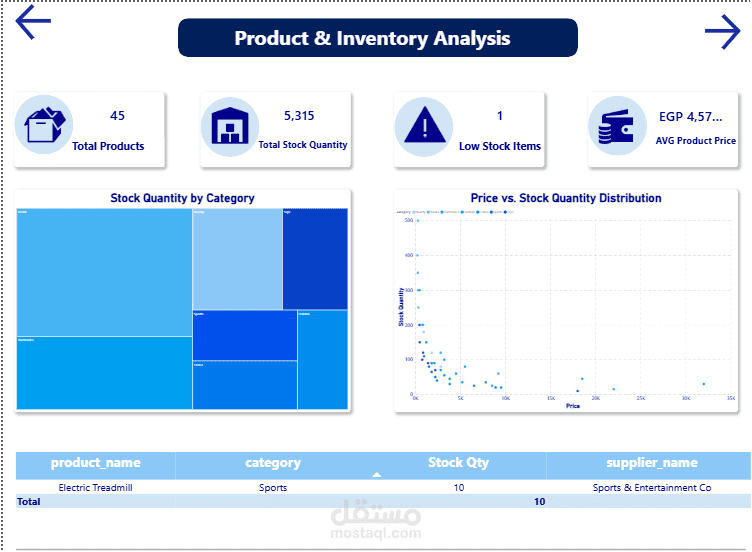
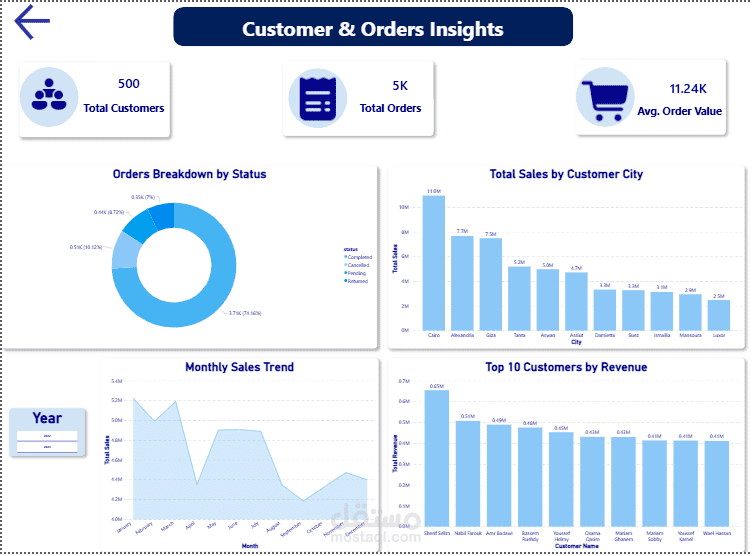
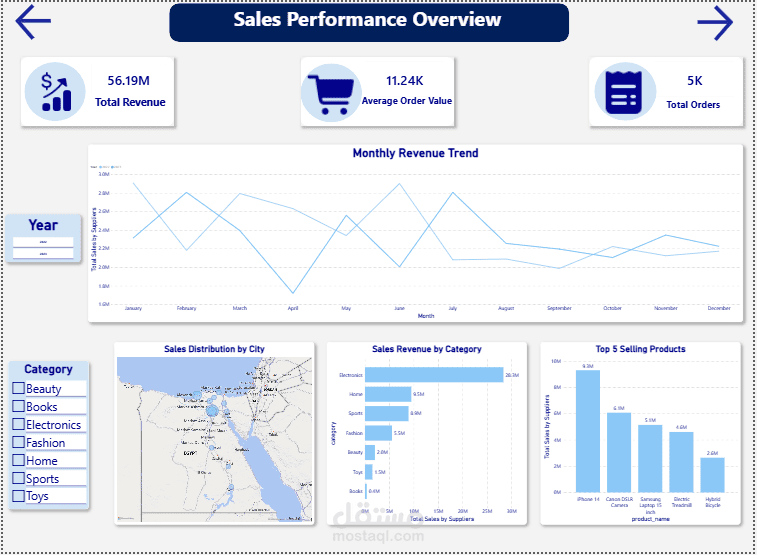
A comprehensive, multi-page Power BI real estate analytics dashboard designed to analyze Property Finder listing data. The dashboard covers market supply, pricing distributions, property specifications, and rental vs. sales market dynamics across top Egyptian cities.
Key Dashboard Pages & Modules:
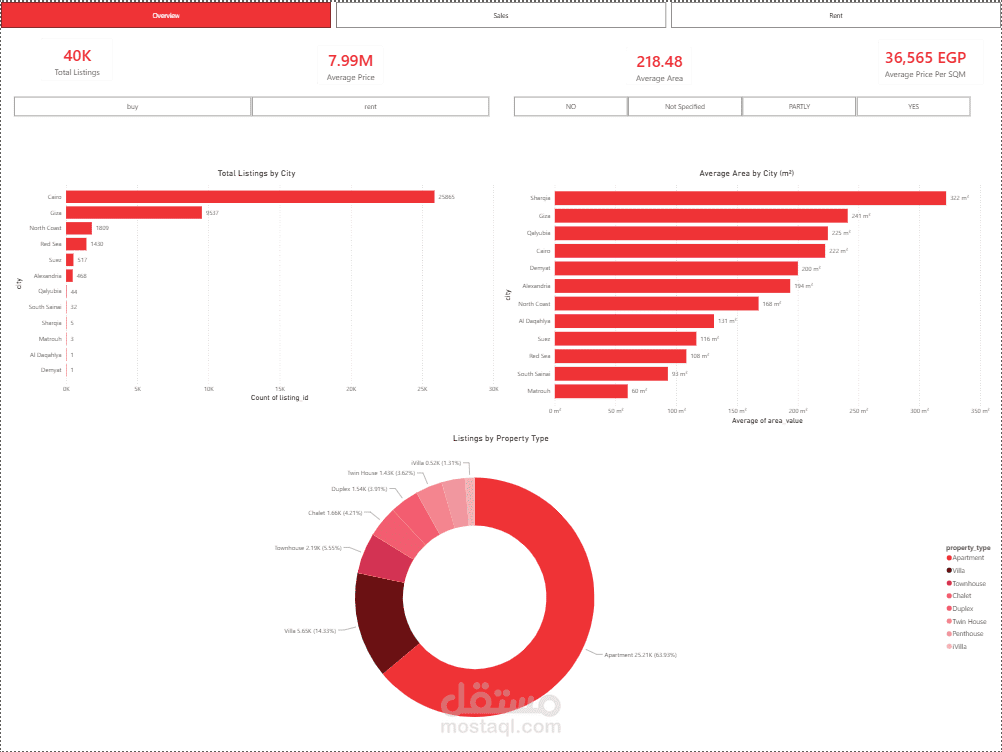
Overview Page: High-level market KPIs (Total Listings: 40K, Avg Price: 7.99M EGP, Avg SQM Price: 36,565 EGP), geographic distribution across cities, and listing breakdown by property type.
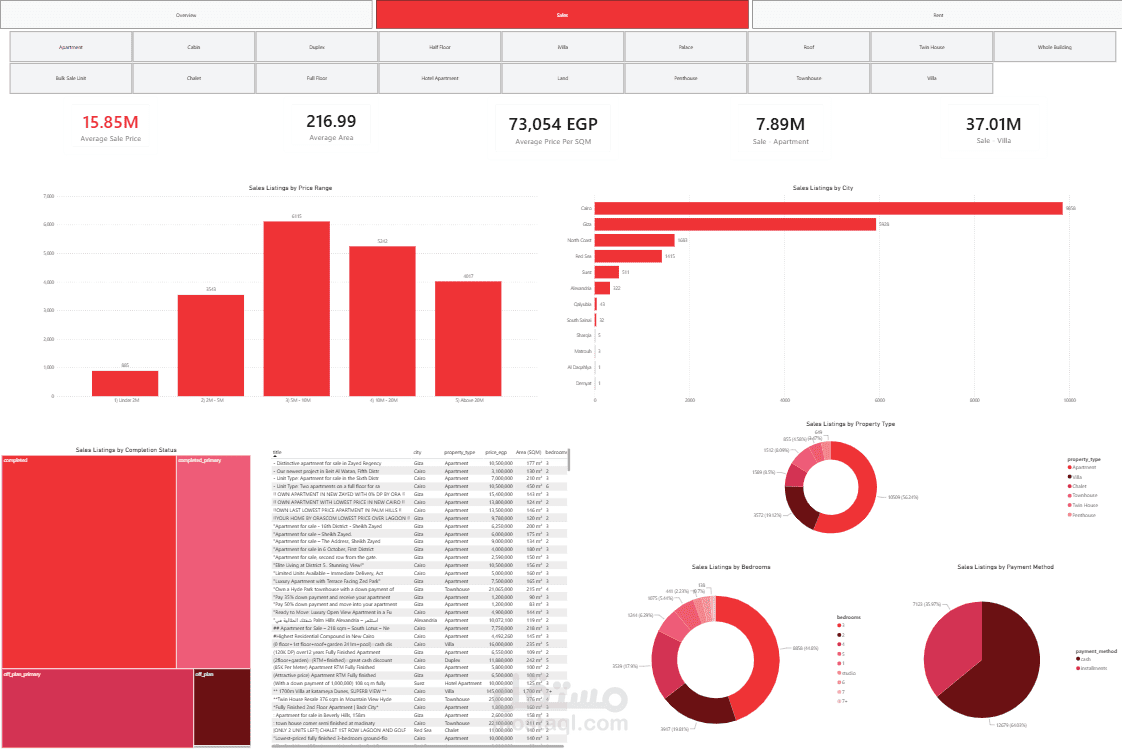
Sales Market Analysis: Deep-dive into sales listings, price range segmentation, city-level sales volumes, completion status, and payment method distribution (Cash vs. Installments).
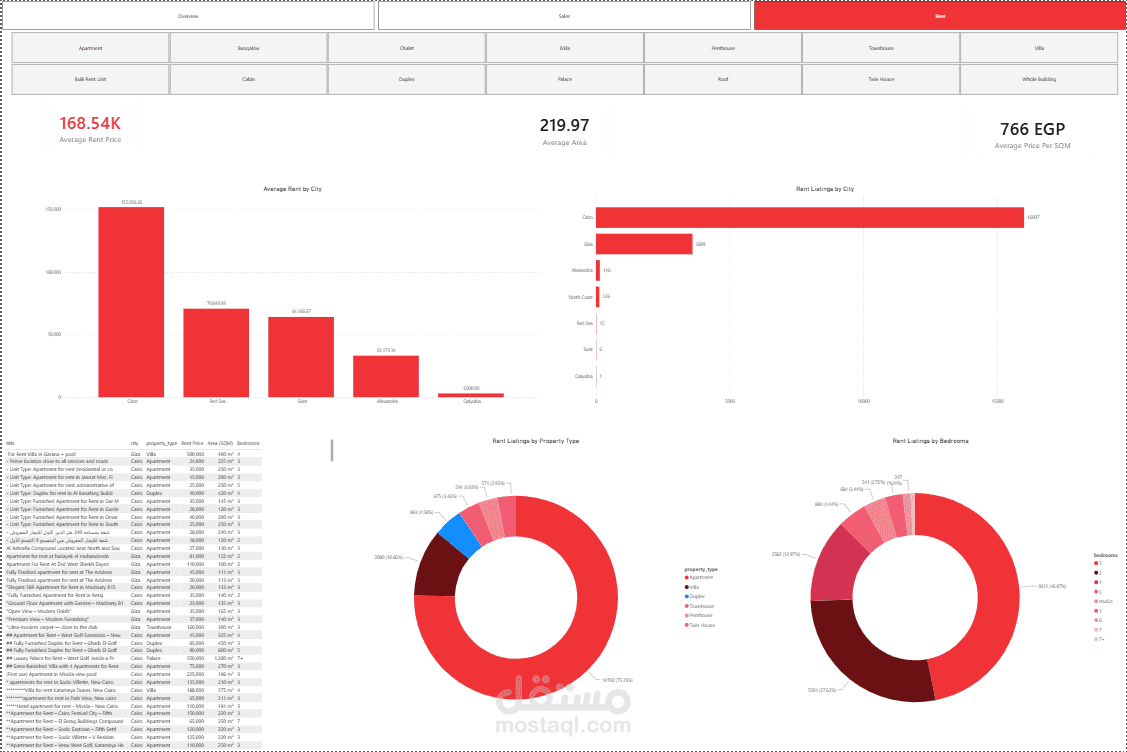
Rent Market Analysis: Rental pricing benchmarks, average rent per city/property type, bedroom distribution, and property availability tables.
Tools & Techniques Used:
Power BI & DAX: Advanced measures, dynamic filters (Slicers), and custom KPI cards.
Data Modeling: Cleaning, structuring, and transforming raw real estate dataset.
Interactive Visualization: Treemaps, Donut charts, Bar charts, and detail data tables.