Retail Store Sales Dashboard – Microsoft Excel
تفاصيل العمل
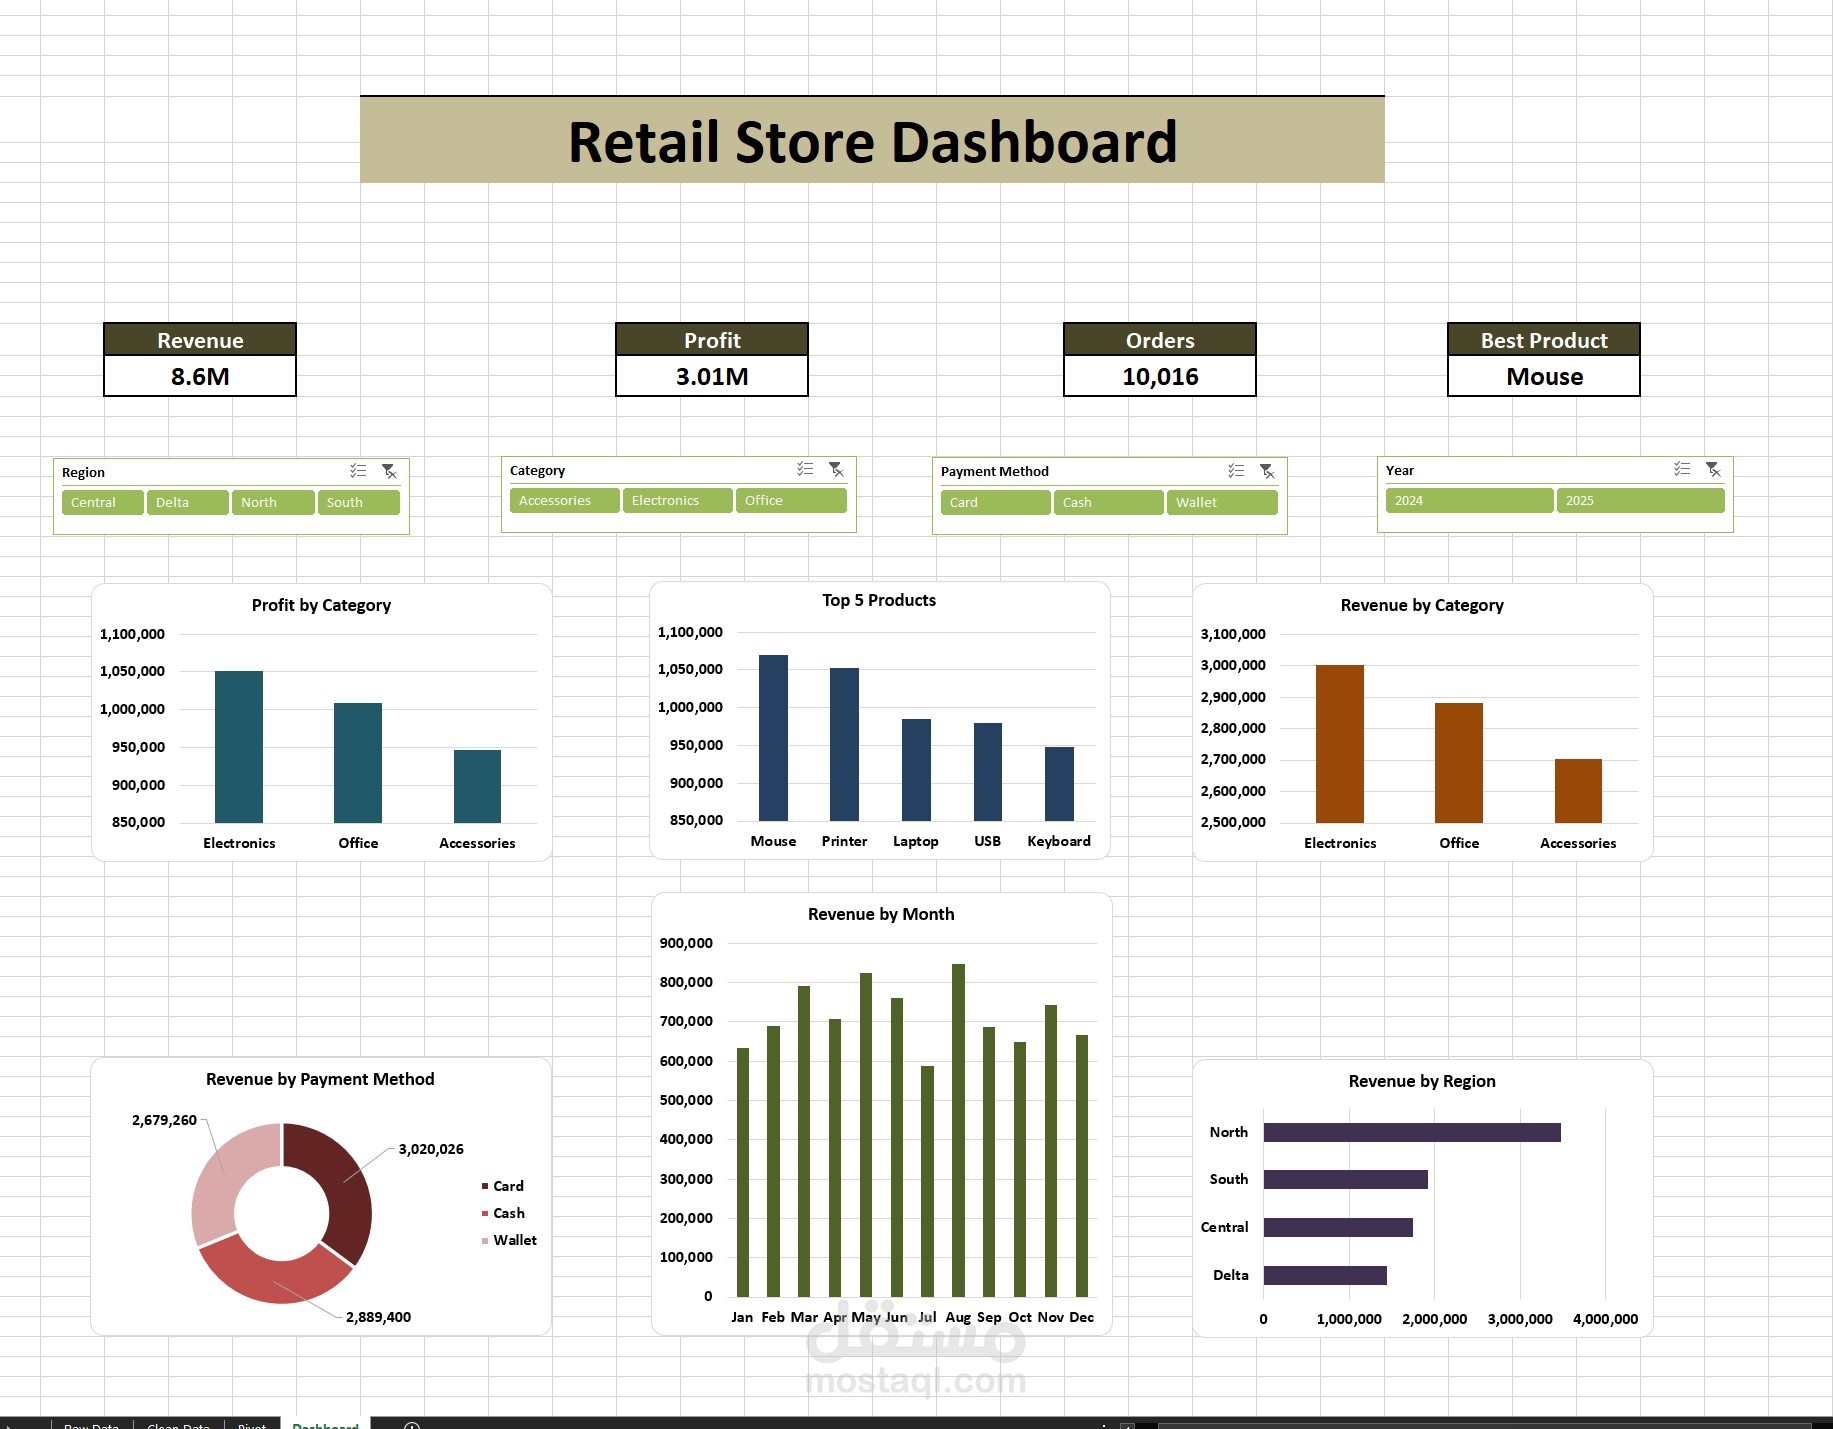
Retail Store Sales Dashboard – Microsoft Excel
قمت بتصميم Dashboard تفاعلي باستخدام Microsoft Excel لتحليل أداء متجر تجزئة، مع الاعتماد على Pivot Tables، Pivot Charts، Slicers، والمعادلات لتوفير لوحة معلومات سهلة الاستخدام.
يحتوي المشروع على:
📊 Revenue Dashboard
💰 Profit Analysis
📦 Total Orders
⭐ Best Selling Product
📈 Revenue by Month
🌍 Revenue by Region
🛍 Revenue by Category
💵 Profit by Category
🏆 Top 5 Products
💳 Revenue by Payment Method
Features:
Interactive Slicers (Region – Category – Payment Method – Year)
Dynamic KPIs that update automatically with filters
Clean and professional dashboard design
Interactive Pivot Charts
Easy-to-read data visualization for decision making
Tools Used:
Microsoft Excel
Pivot Tables
Pivot Charts
Slicers
Excel Formulas
Dashboard Design