Data Cleaning & Automated Excel Sales Analytics
تفاصيل العمل
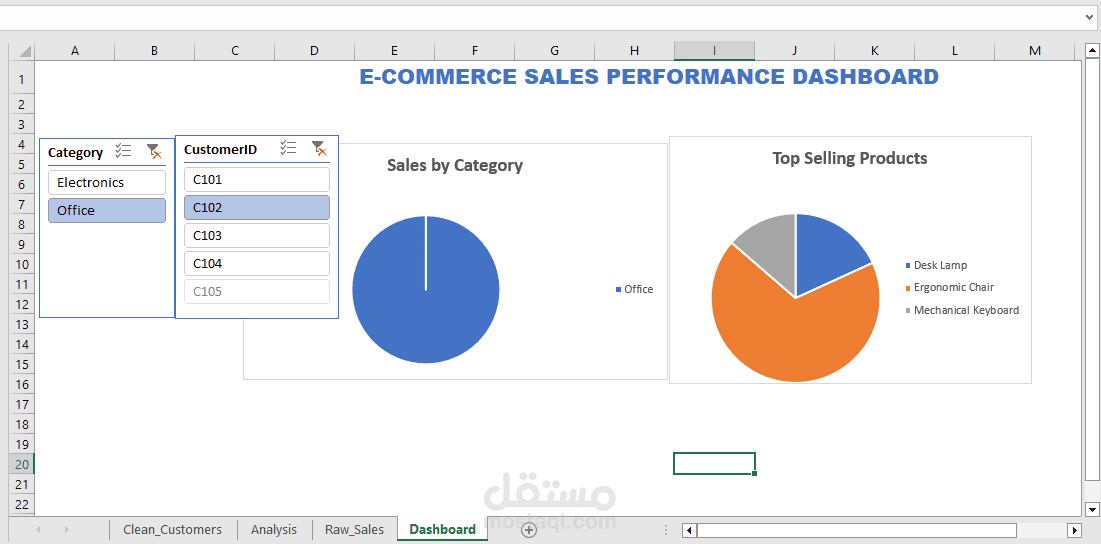
This project demonstrates the end-to-end transformation of unstructured raw sales data (extracted from PDF files) into an automated, executive-ready Interactive Excel Dashboard.
Key Achievements & Technical Scope:
Data Cleaning & Standardization: Cleaned raw text, removed extra spaces (TRIM), formatted customer names (PROPER, UPPER), and unified date/currency formats.
Financial Formulas: Built formulas to calculate gross revenue, applied discounts, and net sales automatically.
Data Modeling & Pivot Tables: Designed Pivot Tables to analyze top-performing products, revenue distribution, and sales categories.
Dynamic Dashboard Design: Developed a clean, user-friendly interface using Pivot Charts and interactive Slicers for real-time filtering.