Financial Performance Dashboard — Actual vs Budget Analysis
تفاصيل العمل
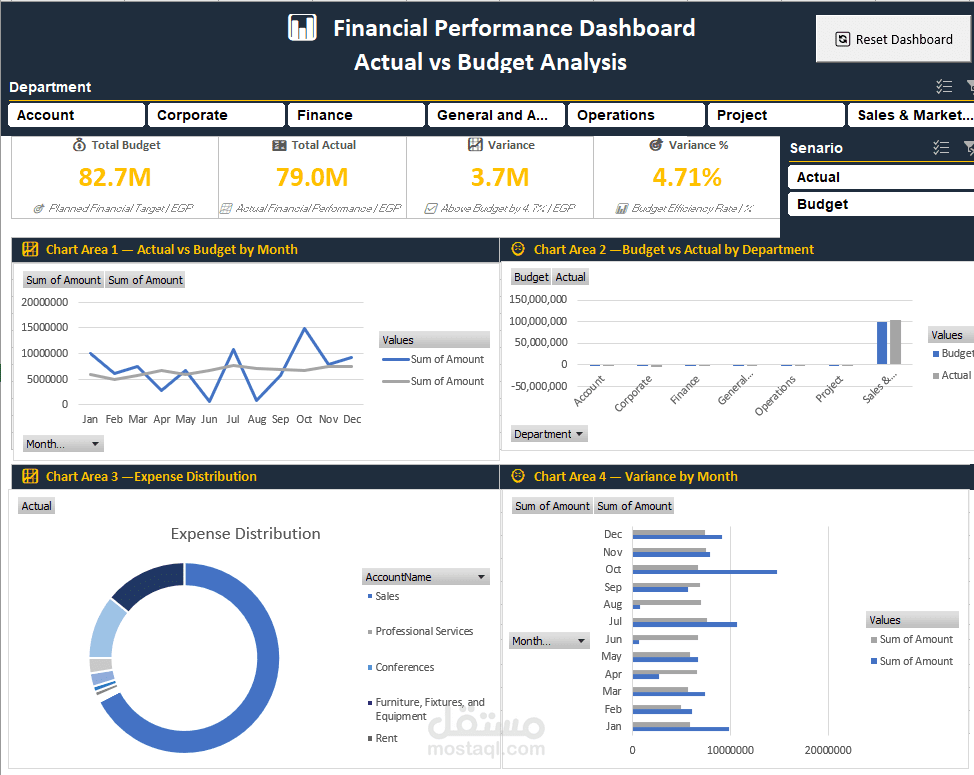
An interactive Power BI dashboard built to track and compare actual vs. budgeted financial performance across departments. It highlights key metrics — total budget, total actual, variance amount, and variance percentage — with slicers for department and scenario (Actual/Budget) to enable dynamic filtering.
The dashboard includes a monthly actual-vs-budget trend line, a department-level budget-vs-actual comparison, an expense distribution breakdown by account, and a monthly variance analysis chart — giving finance teams a clear, drillable view of spending efficiency.
Skills: excel. Financial Reporting · Data Visualization · Variance Analysis · Dashboard Design