Boutique Dashboard
تفاصيل العمل
🔹 Project Overview
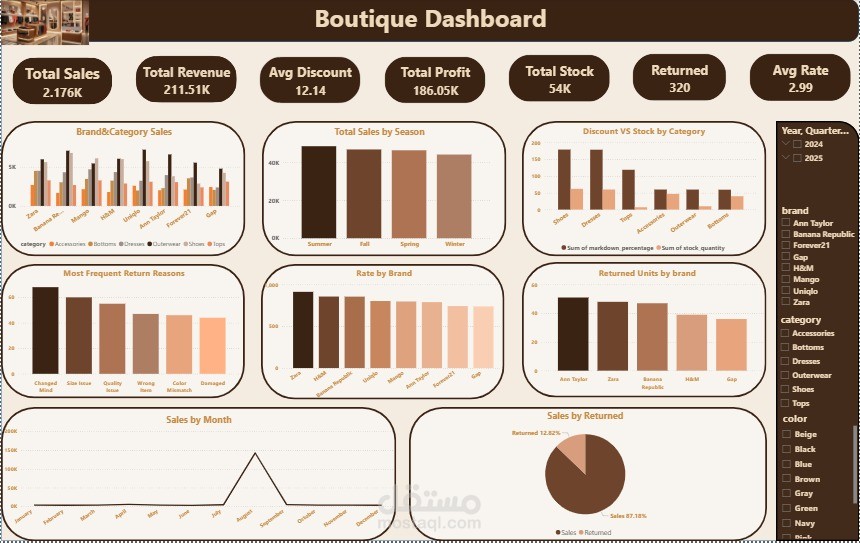
A specialized retail analytics dashboard designed to monitor performance, product health, and customer satisfaction for a multi-brand fashion boutique. The dashboard tracks essential sales KPIs, evaluates seasonal demand, isolates inventory markdown impacts, and analyzes post-purchase behavior—specifically targeting product return rates and customer rating metrics to guide inventory curation and quality control.
🛠️ Tools
Data BI & Visualization: python / Power BI / Excel (Dynamic multi-attribute slicing by Brand, Category, Color, and Timeline, custom Pareto-style distribution charts, and seasonal line-trend analytics).
📈 Outcomes
Core Performance KPIs: Aggregates critical high-level business metrics, capturing 2.17K items sold, $211.51\text{K}$ in Total Revenue, and a strong net Total Profit of $186.05\text{K}$.
Inventory & Return Diagnostics: Monitors stock health with a 54K total stock volume, cross-referencing 320 returned items ($12.82\%$ return share) against a frequency chart identifying "Changed Mind" and "Size Issues" as top return drivers.
Brand & Markdown Insights: Compares discount percentages versus stock levels across categories (e.g., Shoes, Dresses), while ranking brand popularity and customer sentiment (Average Rating: 2.99), spearheaded by Zara and H&M.
Seasonality Trends: Identifies Summer as the peak-performing sales season, backed by a micro-view of monthly sales spikes to optimize inventory purchasing schedules.