Broker Groups Executive Dashboard | Excel KPI Reporting & Sales Analytics
تفاصيل العمل
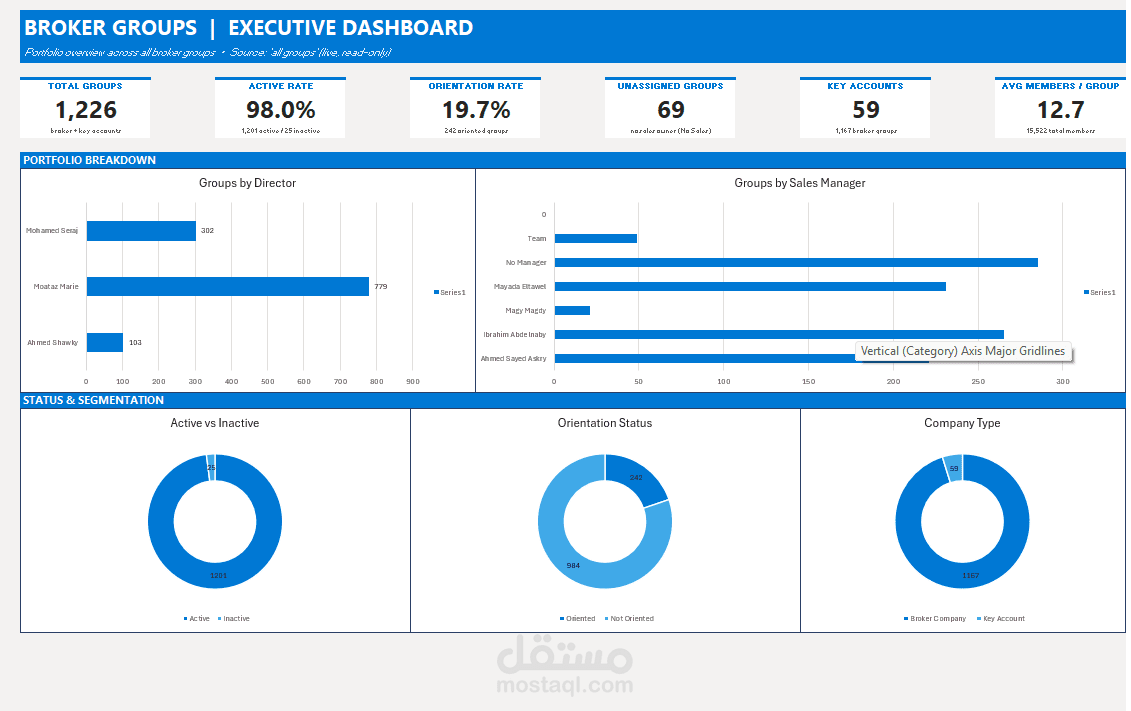
Designed and developed an Executive Dashboard in Microsoft Excel to provide leadership teams with a complete overview of broker portfolio performance and operational KPIs.
The dashboard consolidates large datasets into actionable insights through interactive KPI cards, performance charts, and portfolio segmentation, enabling faster and more informed business decisions.
Key Features:
• Executive KPI Dashboard
• Broker Portfolio Analysis
• Sales Manager Performance
• Director Performance Breakdown
• Active vs Inactive Monitoring
• Orientation Status Analysis
• Key Account Tracking
• Average Members per Group
• Portfolio Segmentation
• Interactive Charts & Visual Reporting
Business Value:
• Improved executive visibility into broker performance
• Simplified portfolio monitoring
• Faster identification of operational gaps
• Better resource allocation and decision-making
• Reduced manual reporting effort
Tools Used:
• Microsoft Excel
• Power Query
• Pivot Tables
• Pivot Charts
• Advanced Excel Formulas
• Dashboard Design
• Conditional Formatting
• Business Intelligence Reporting