Enterprise dashboard
تفاصيل العمل
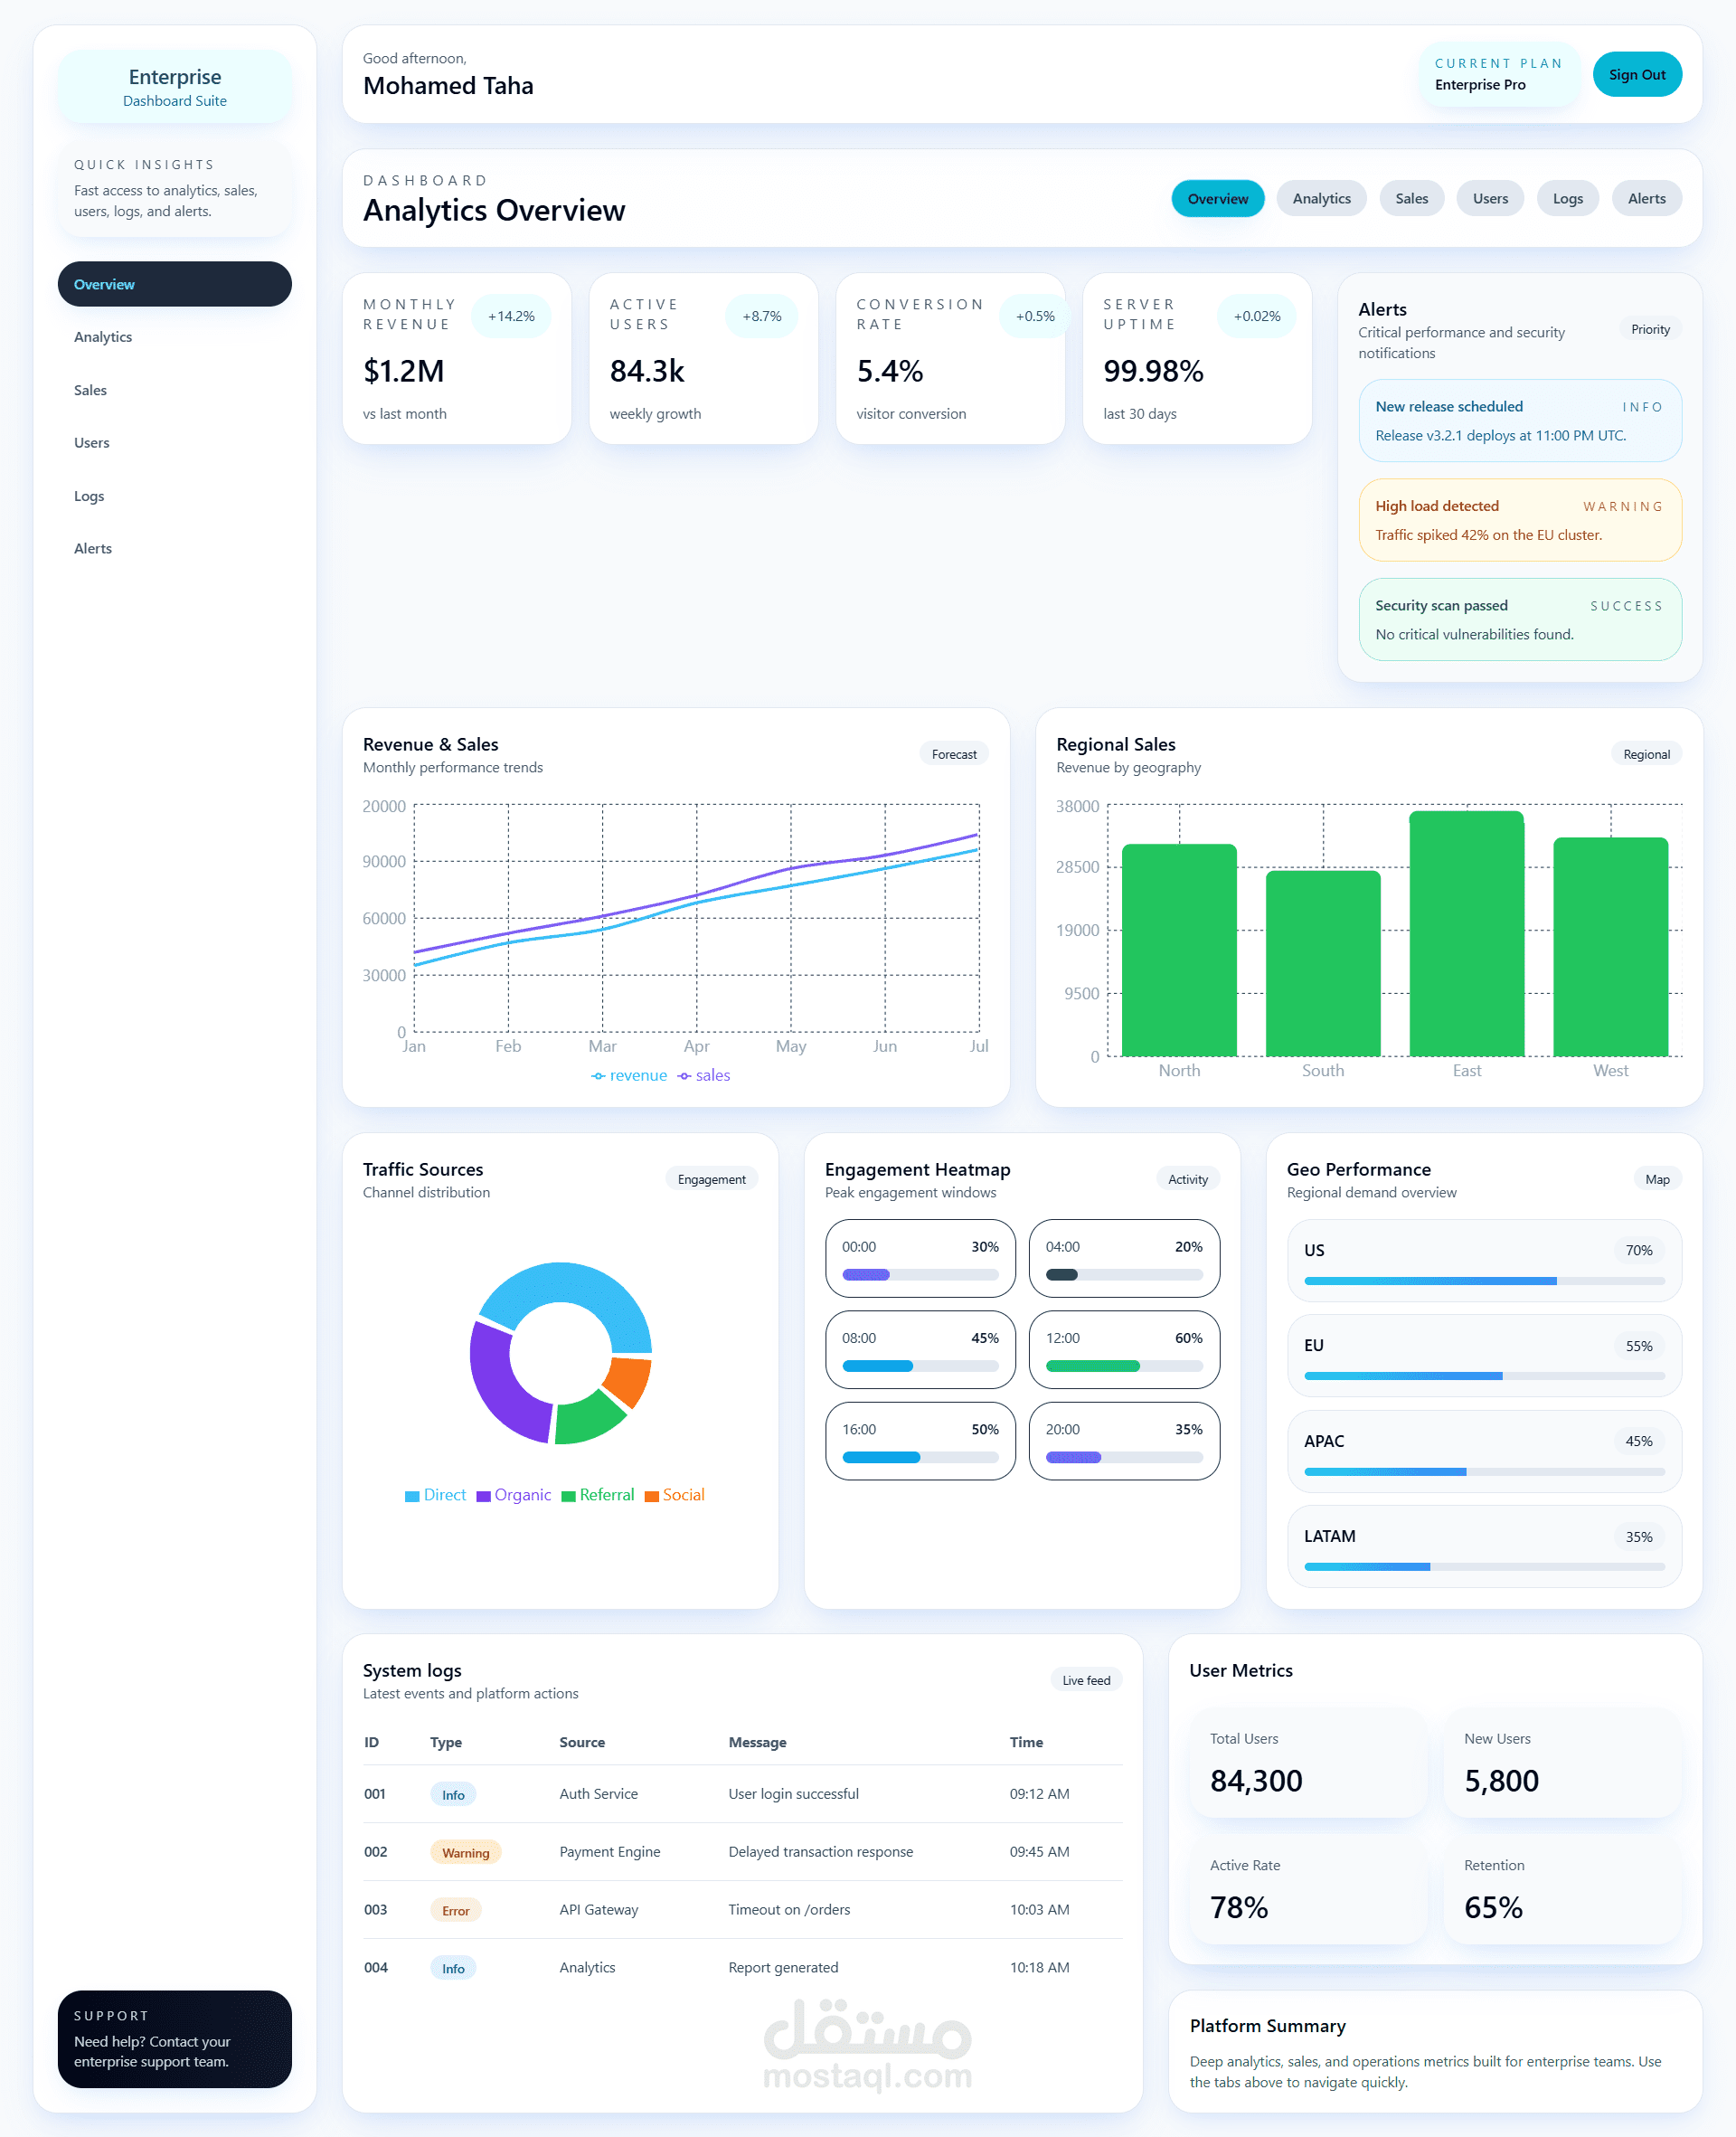
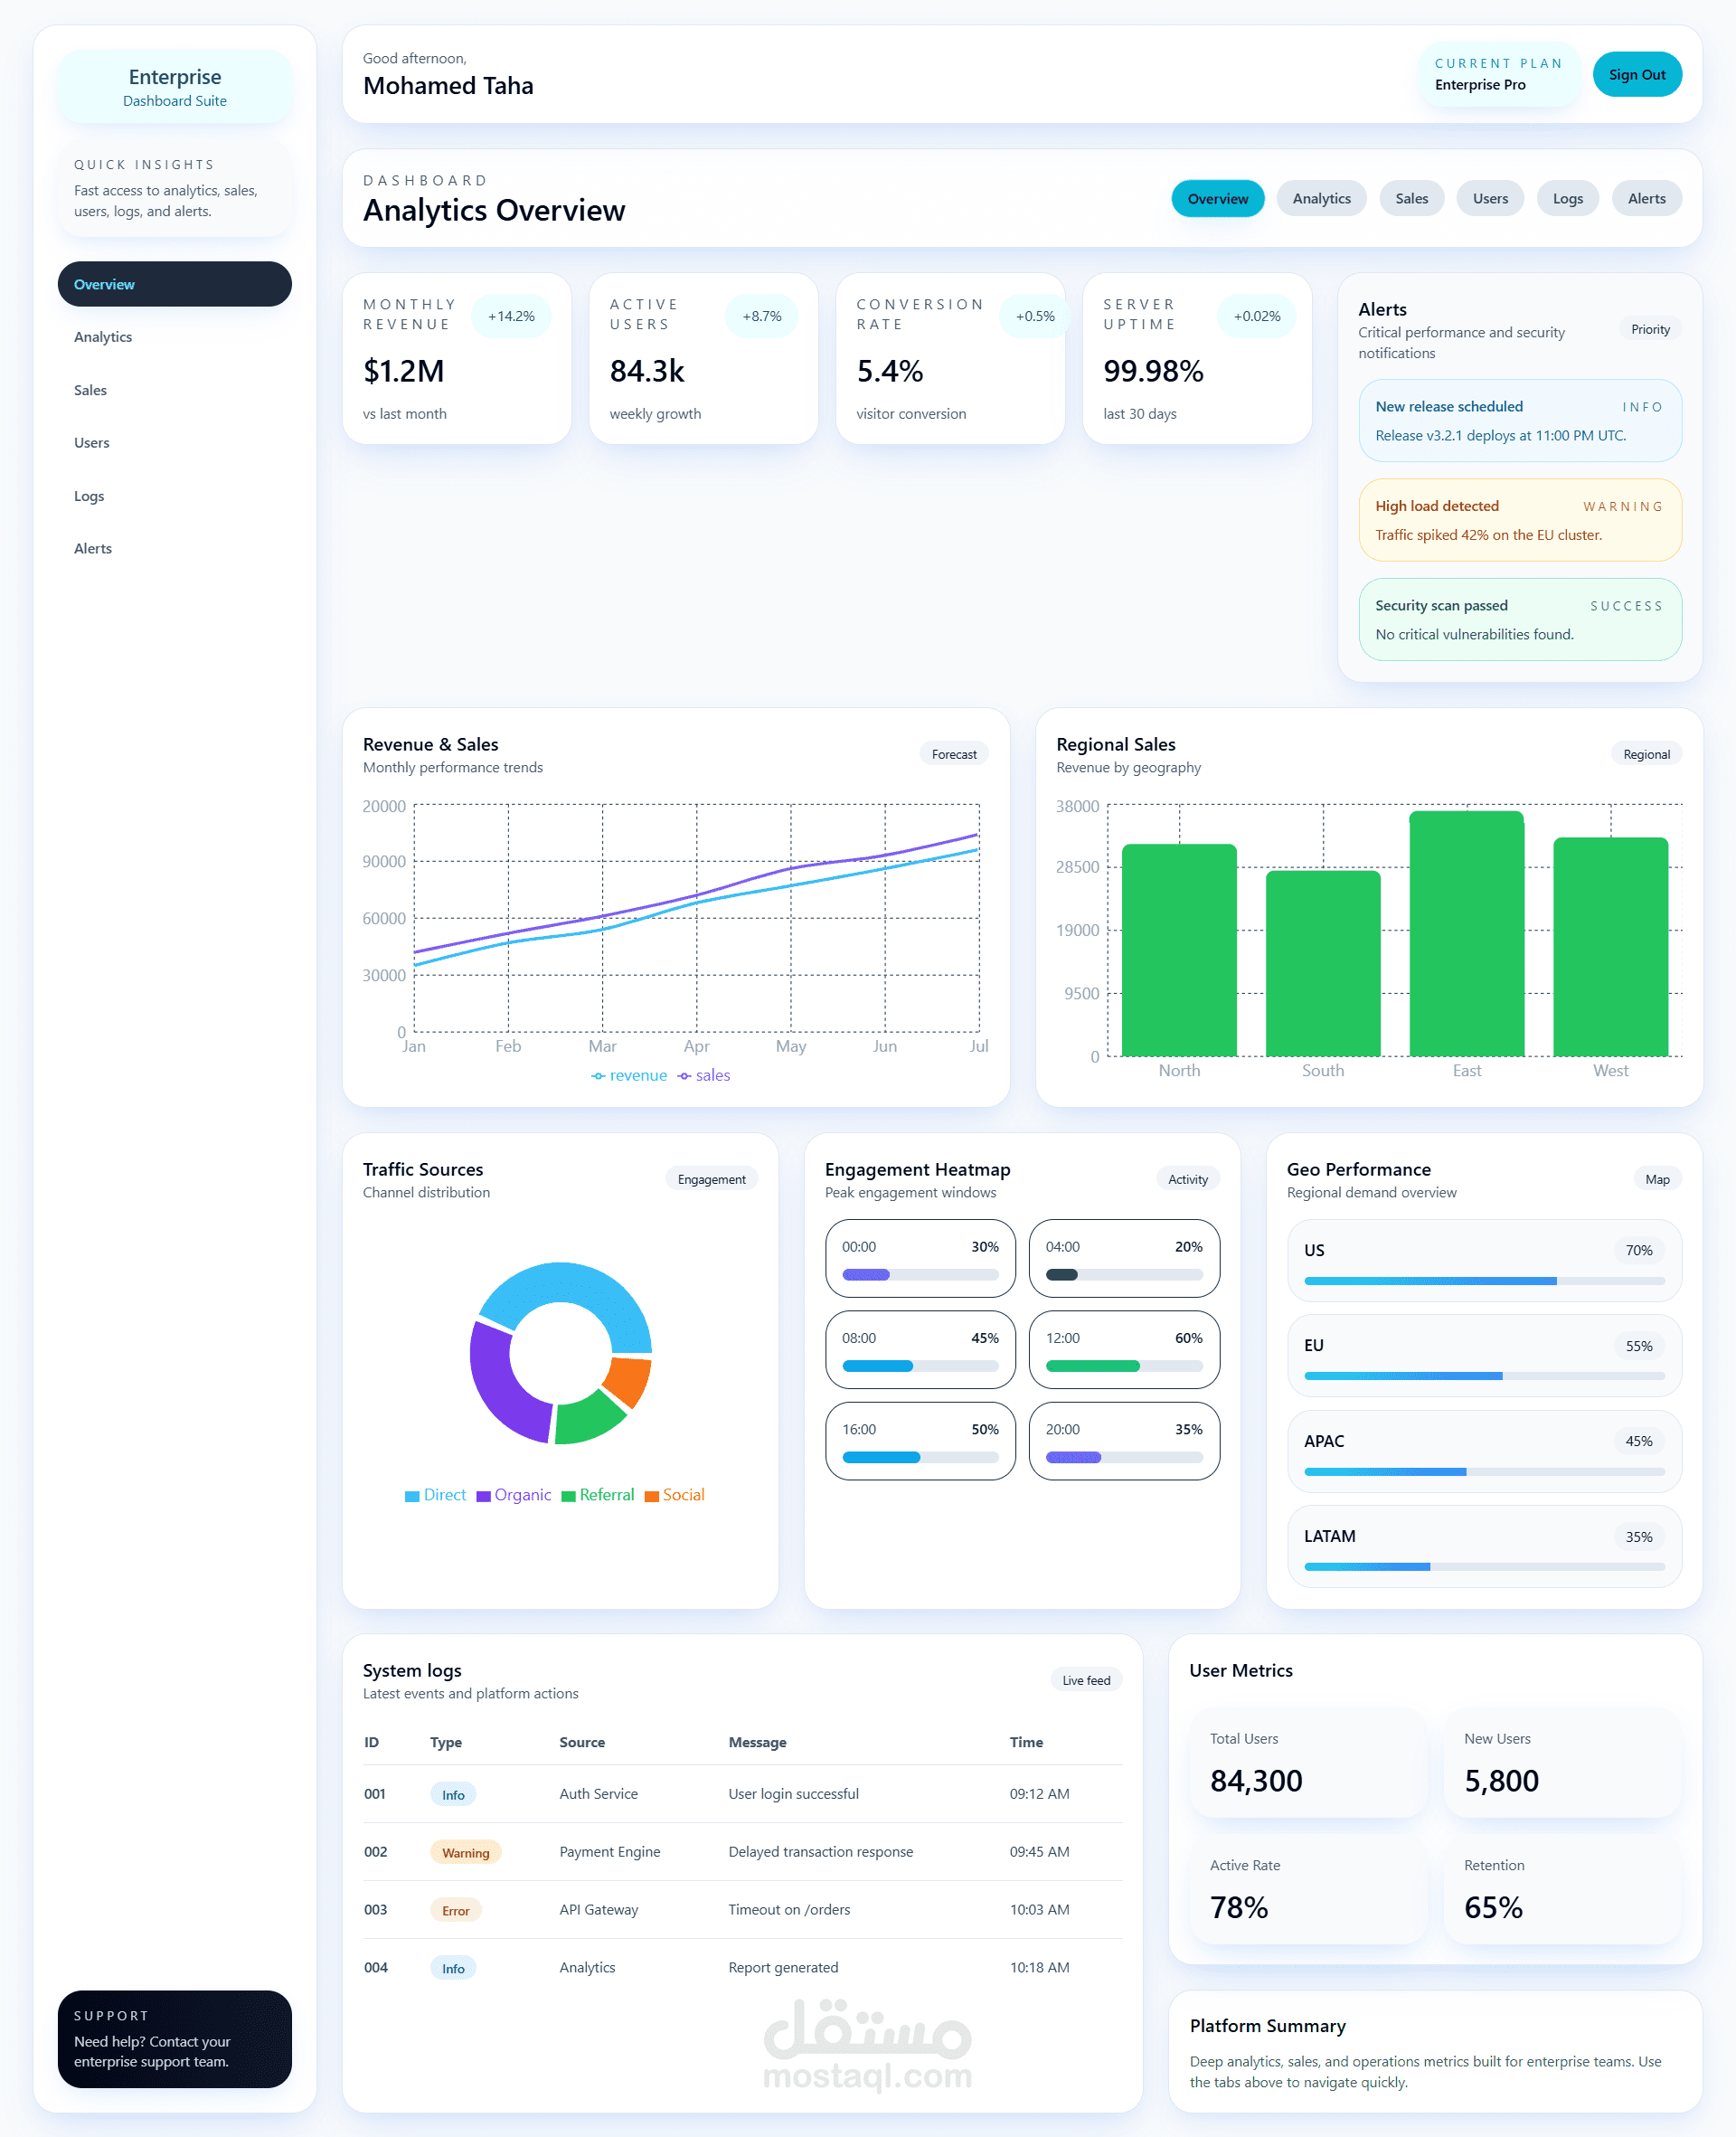
Engineered a comprehensive, data-dense Enterprise Analytics Dashboard designed to deliver real-time operational insights, metric visualization, and platform health monitoring in a single, responsive layout.
Key Highlights:
Interactive Data Visualization: Integrated multi-type data visualizations—including interactive line charts for monthly revenue trends, bar charts for regional sales, donut charts for traffic sources, and geo-performance progress indicators.
Real-Time System & Alert Monitoring: Built dynamic UI components for live system logs (status tags, timestamps, source routing) and critical system alert cards (deployments, load warnings, security scans).
KPI Metric Cards & Heatmaps: Designed high-level metric cards showcasing monthly growth stats alongside engagement heatmap cards with progress tracking.
Modern, Scalable UI/UX: Styled using a clean, light-mode design system with responsive sidebar navigation, modular grid structure, and accessible tab-based sub-navigation.