Sales Analyst Project
تفاصيل العمل
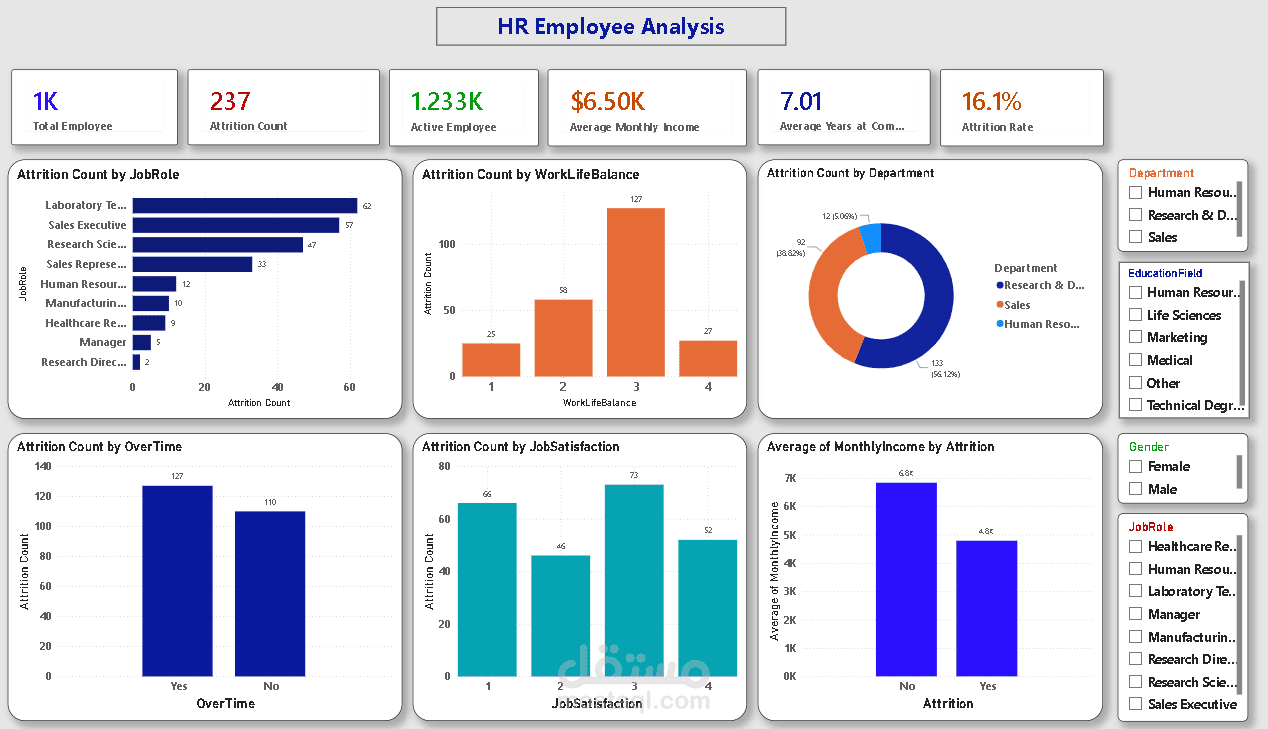
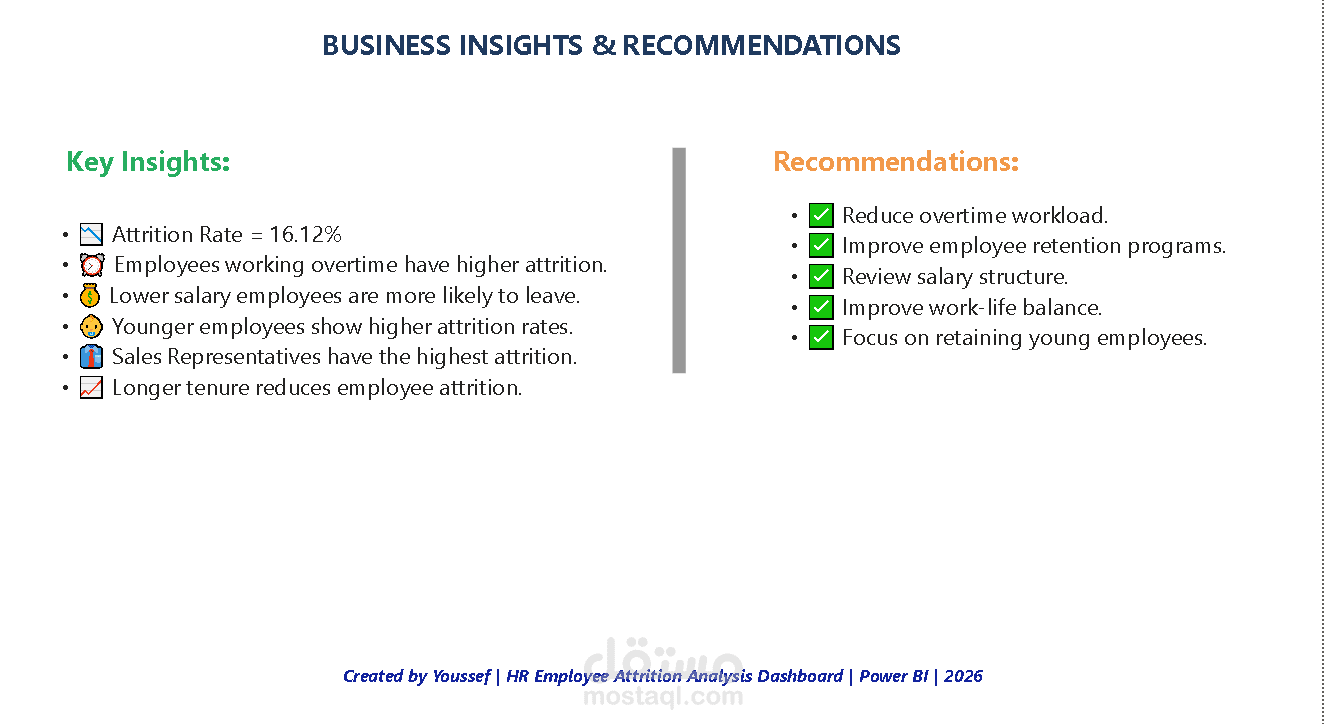
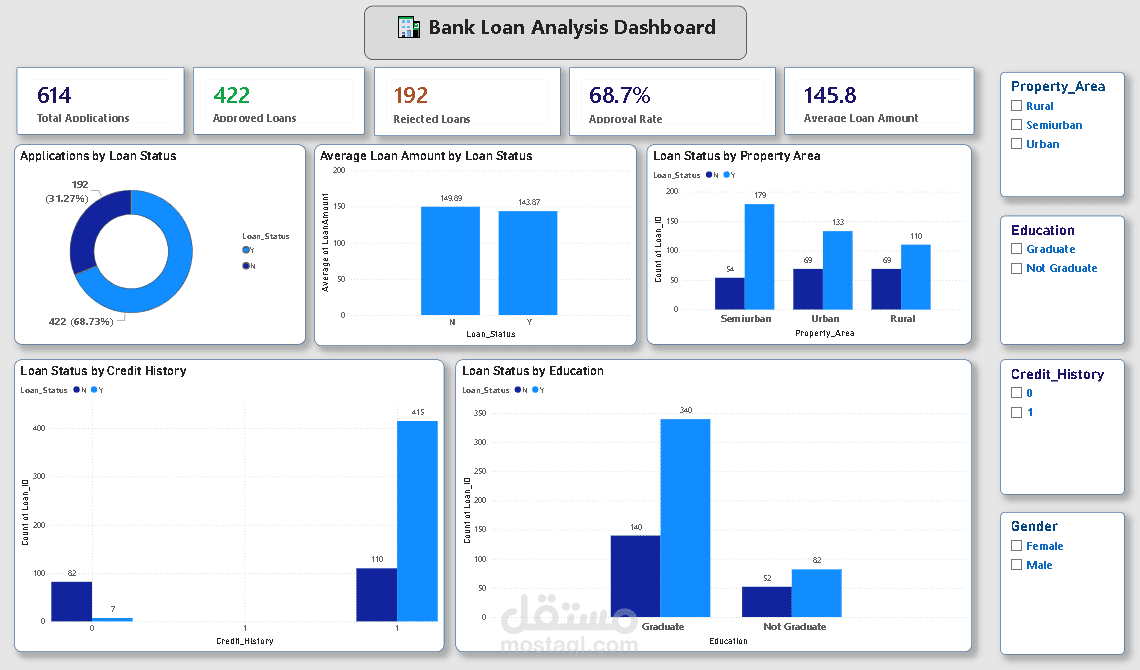
📊 Superstore Sales Analysis Dashboard
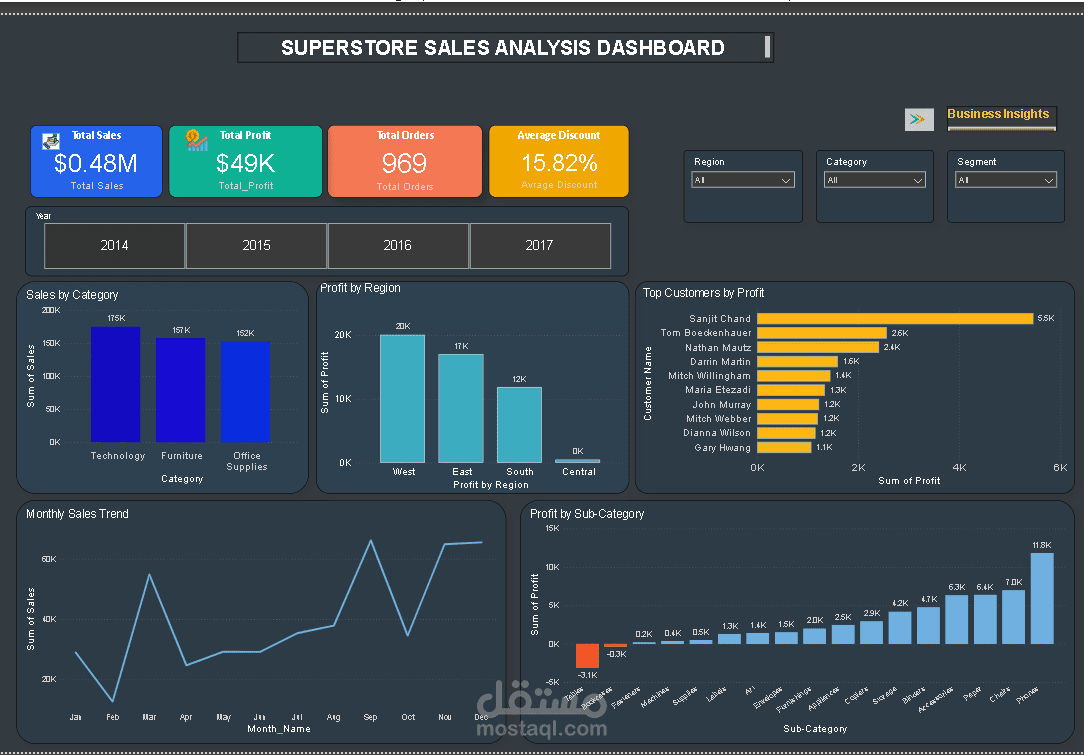
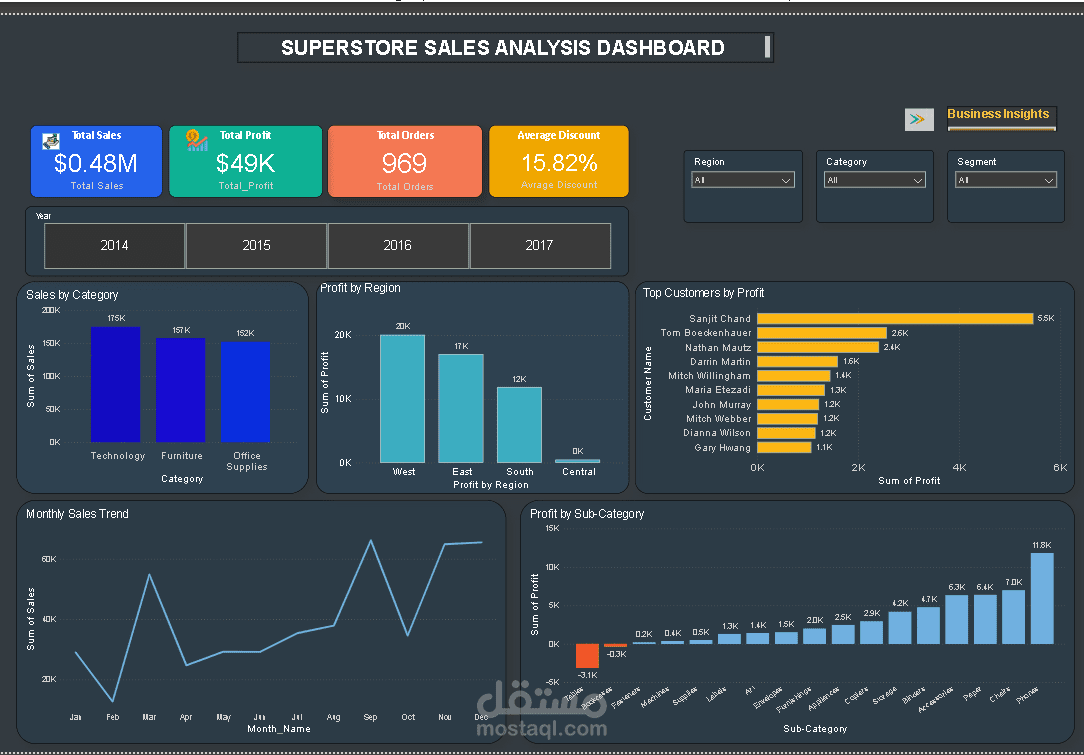
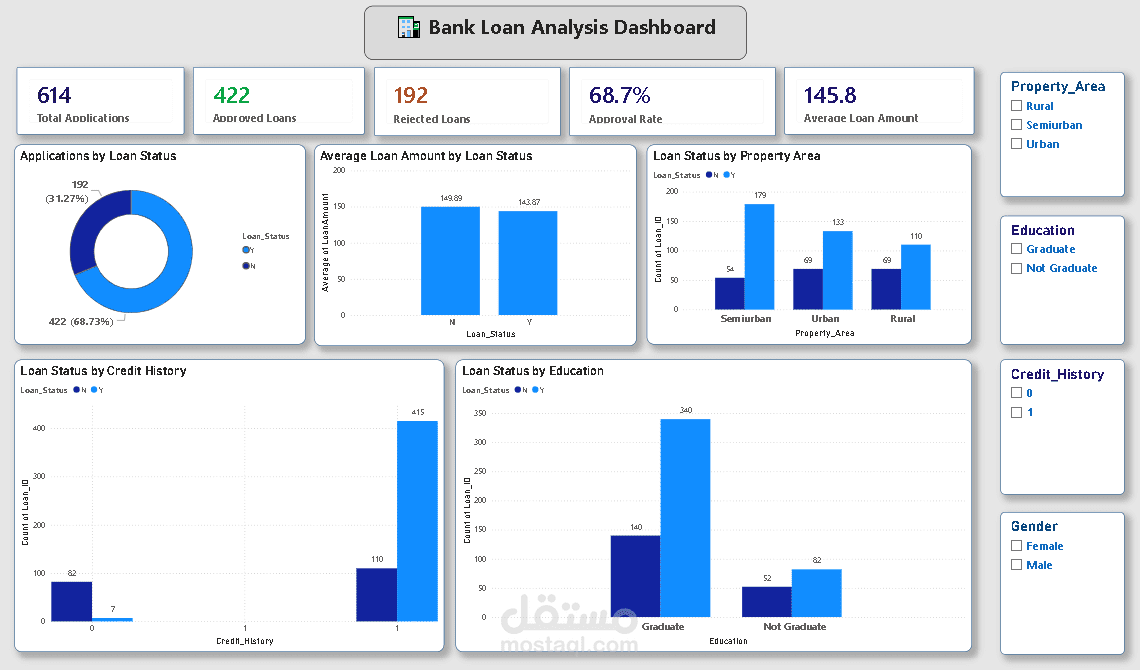
I recently completed an interactive Power BI dashboard to analyze Superstore sales data and uncover valuable business insights.
🔧 Tools & Skills Used:
Power BI
Power Query
Data Cleaning
Data Visualization
Business Intelligence
Dashboard Design
📈 Dashboard Highlights:
Interactive Sales & Profit Analysis
Customer Performance Analysis
Regional Performance Analysis
Monthly Sales Trend
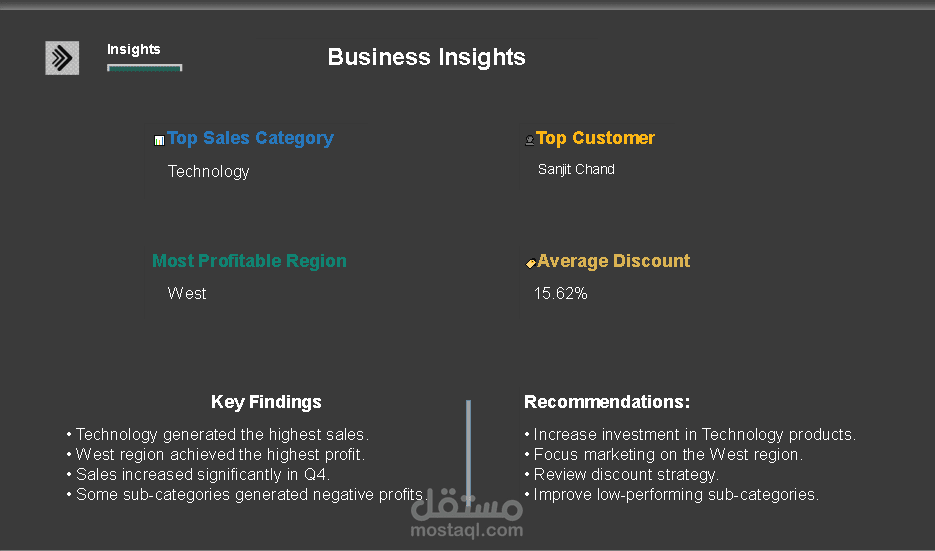
Business Insights & Recommendations
Interactive Filters & Navigation
🔍 Key Insights:
Technology is the top-performing category.
The West region generated the highest profit.
Sales showed strong growth during Q4.
Some sub-categories generated negative profits, highlighting areas for improvement.
💡 Business Recommendations:
Increase investment in high-performing categories.
Focus marketing efforts on profitable regions.
Review discount strategies to improve profitability.
Optimize underperforming product categories.
This project helped me improve my skills in data analysis, dashboard design, and transforming raw data into actionable business insights.
I'm continuously learning and looking forward to building more data analytics projects.
I'd love to hear your feedback!