HR Analytics Dashboard Project
تفاصيل العمل
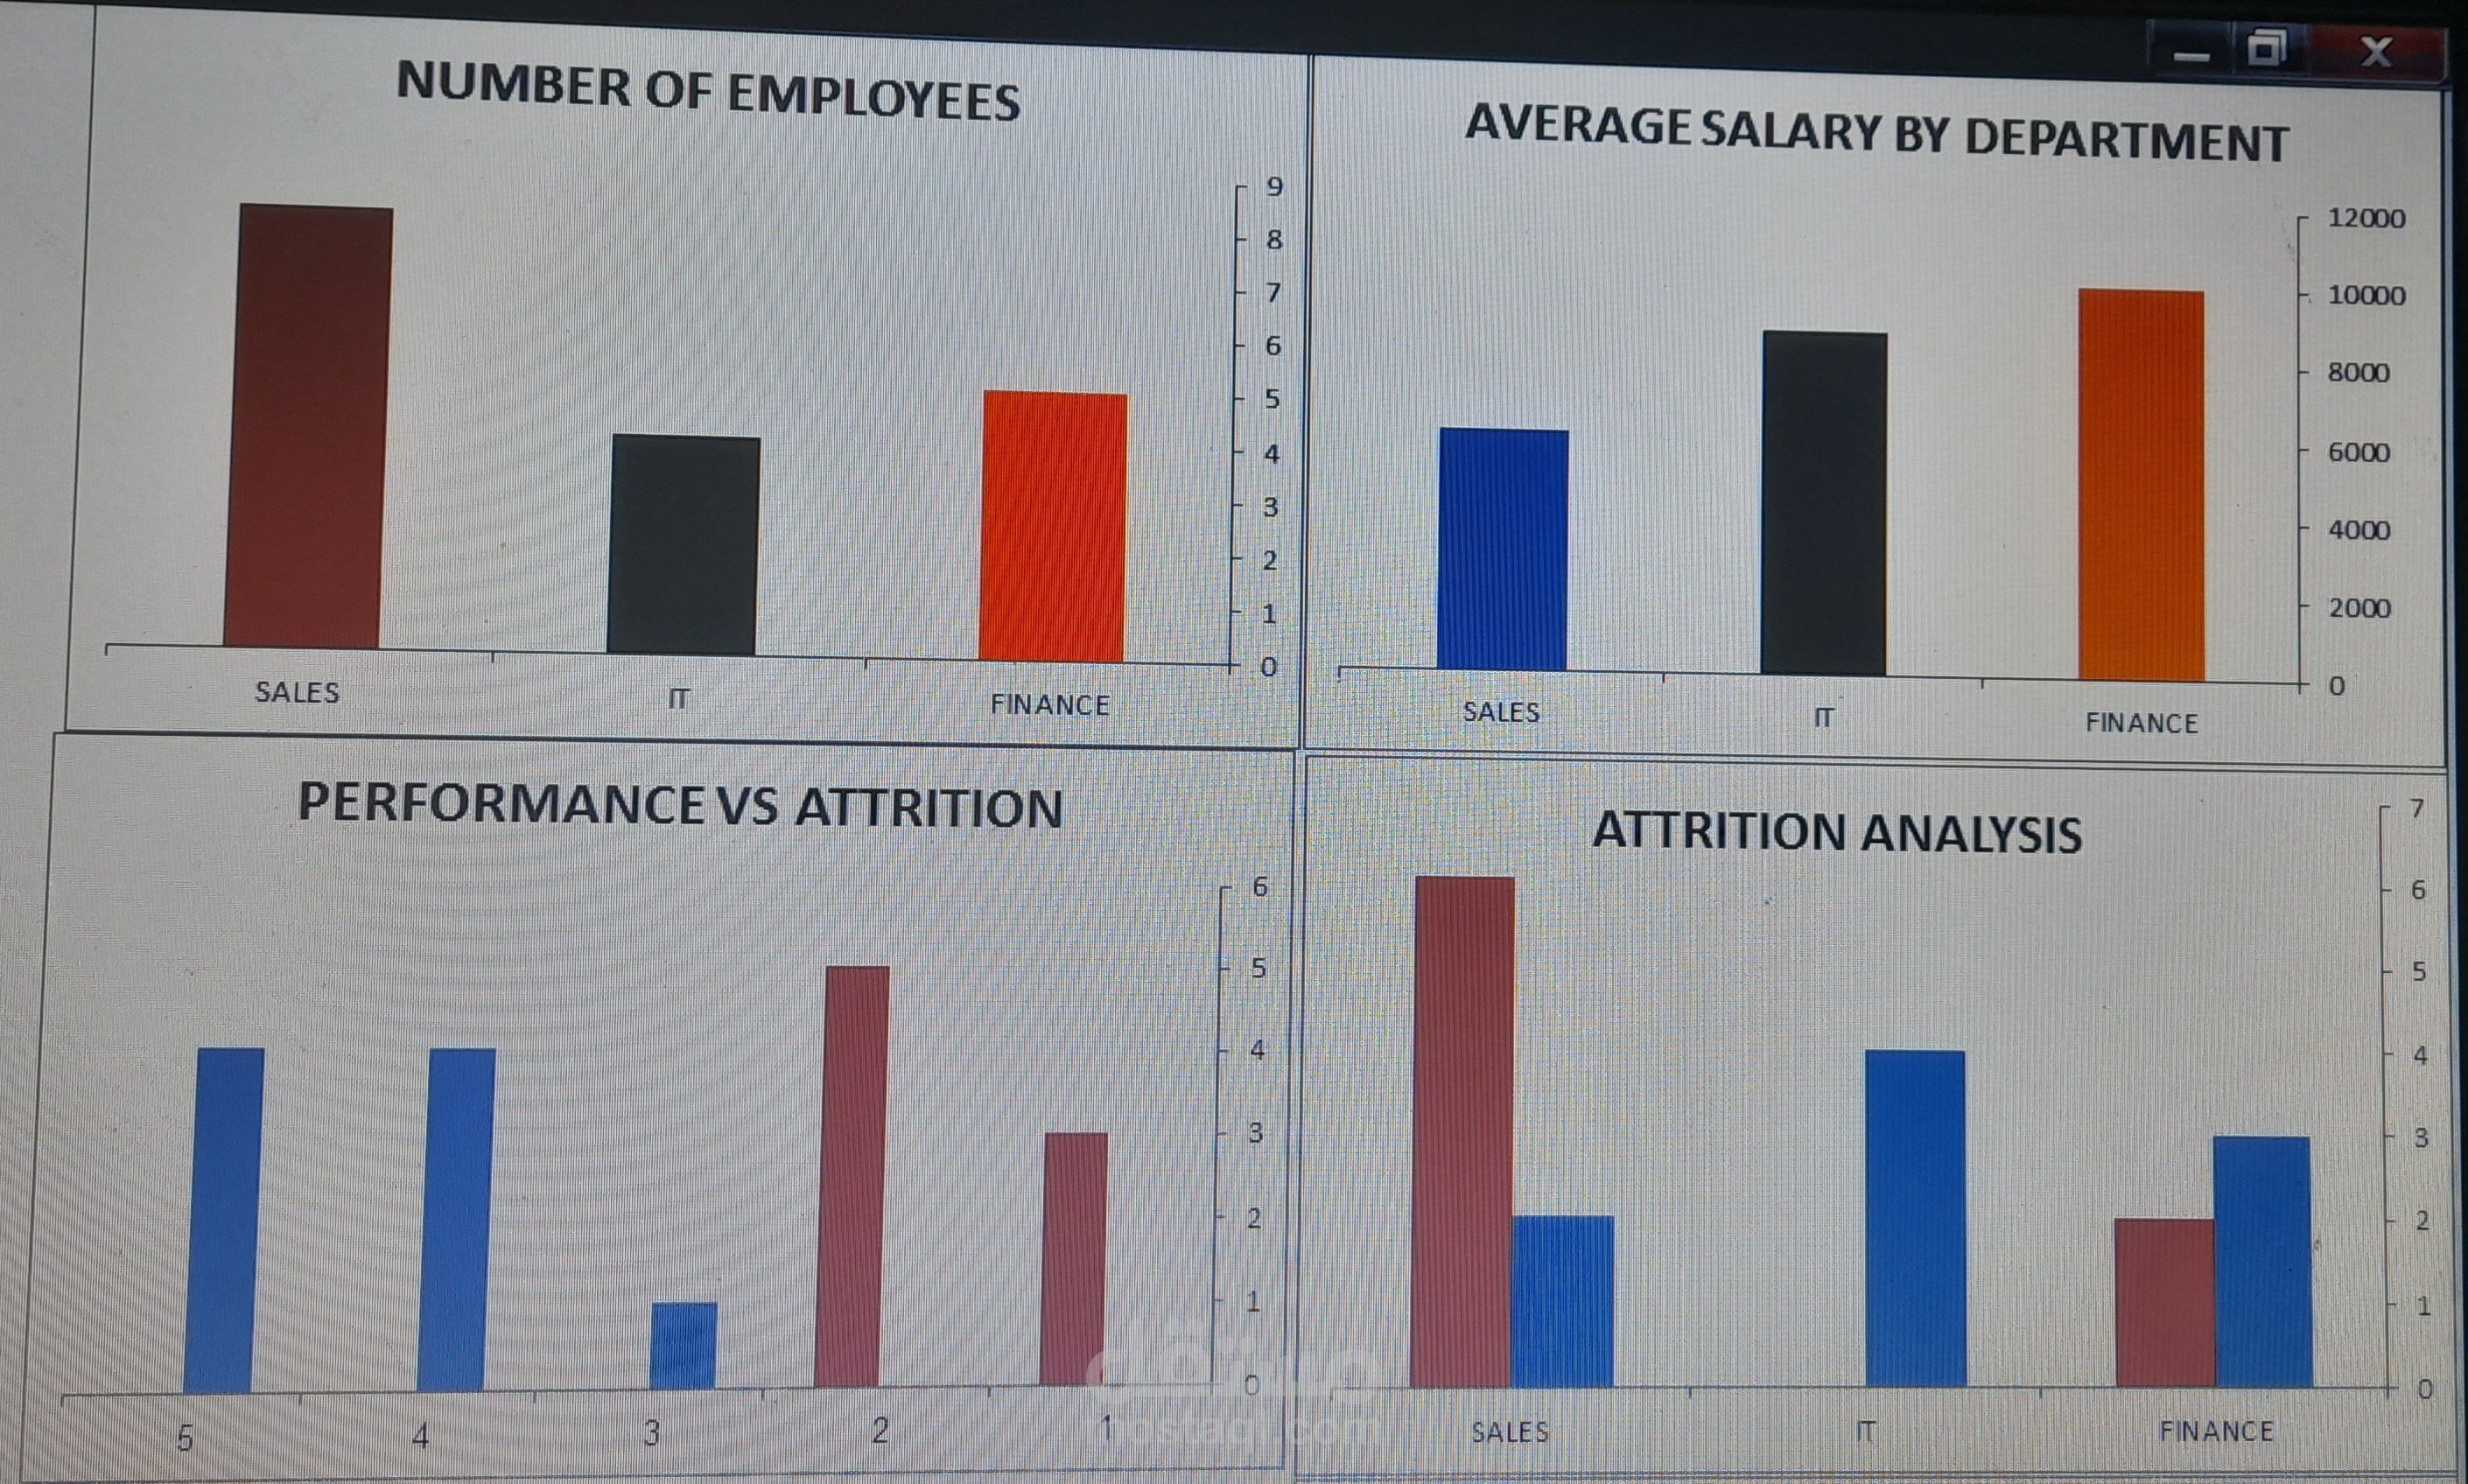
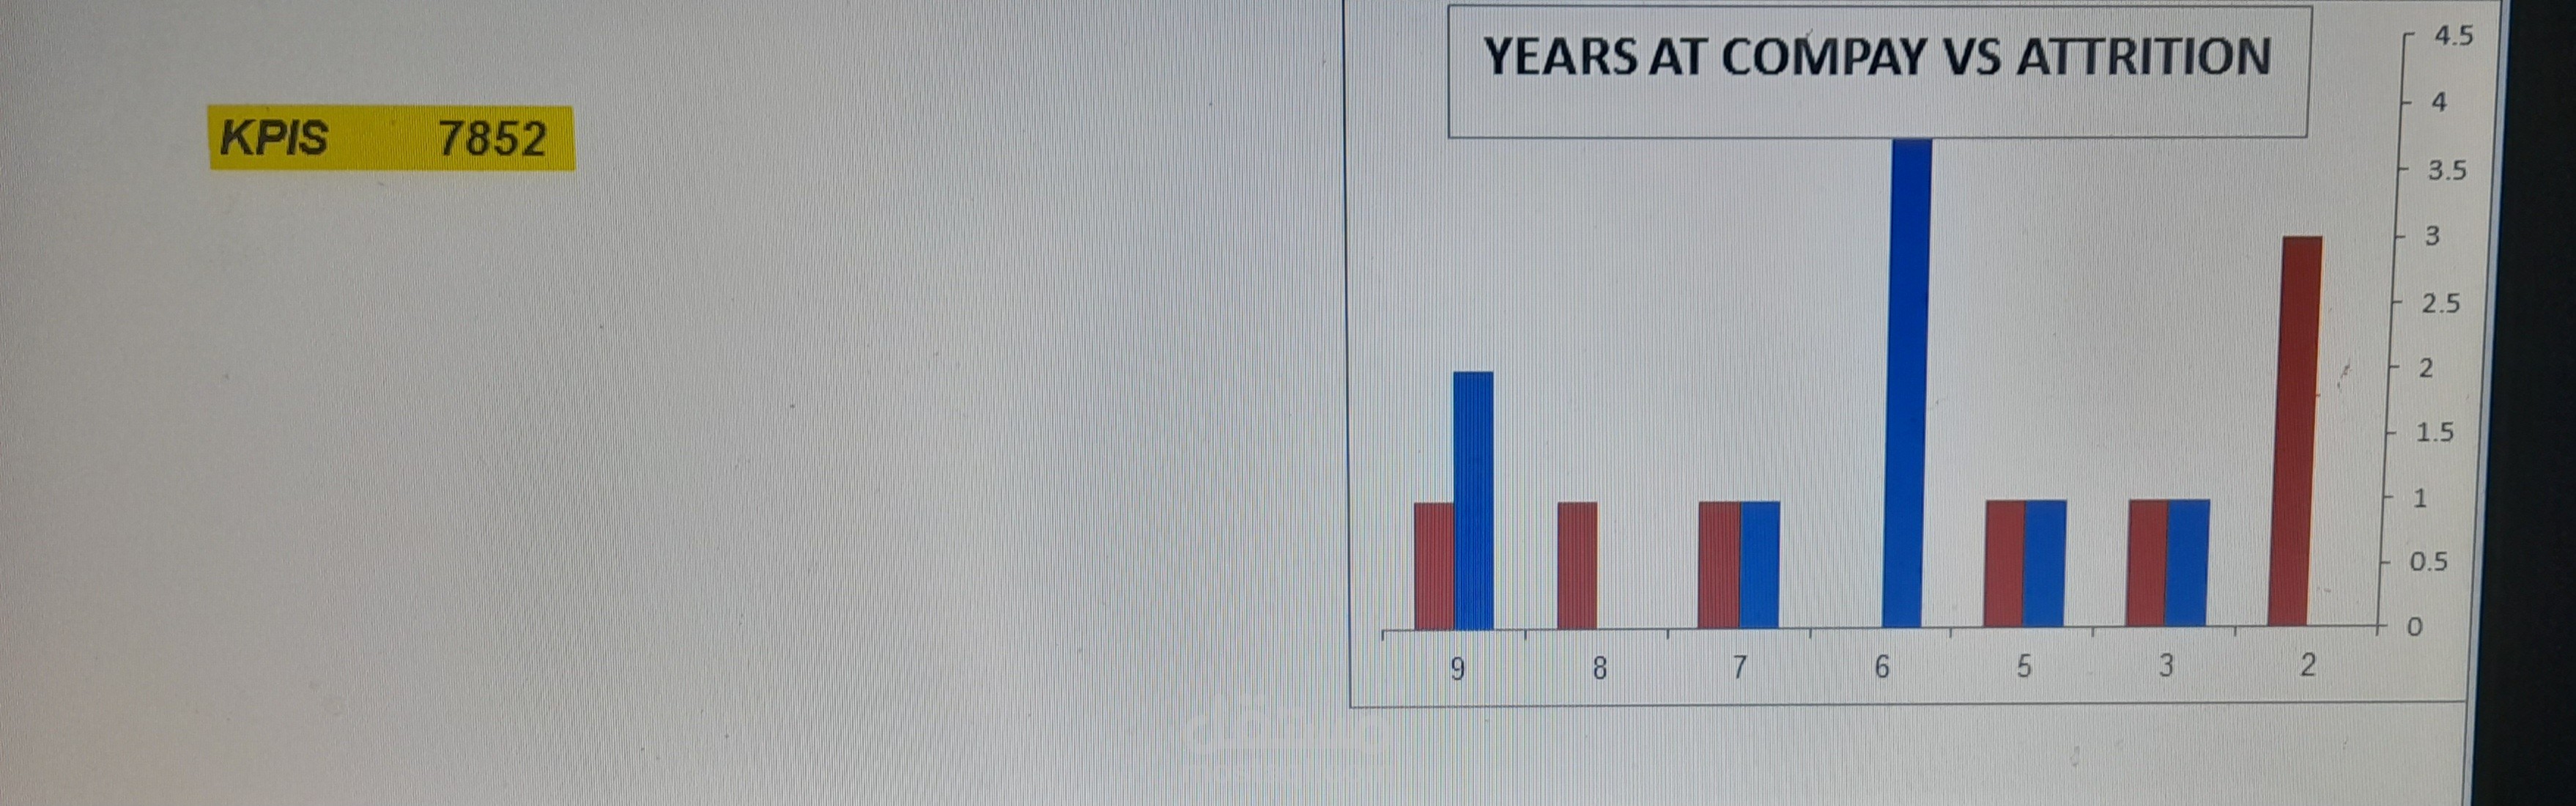
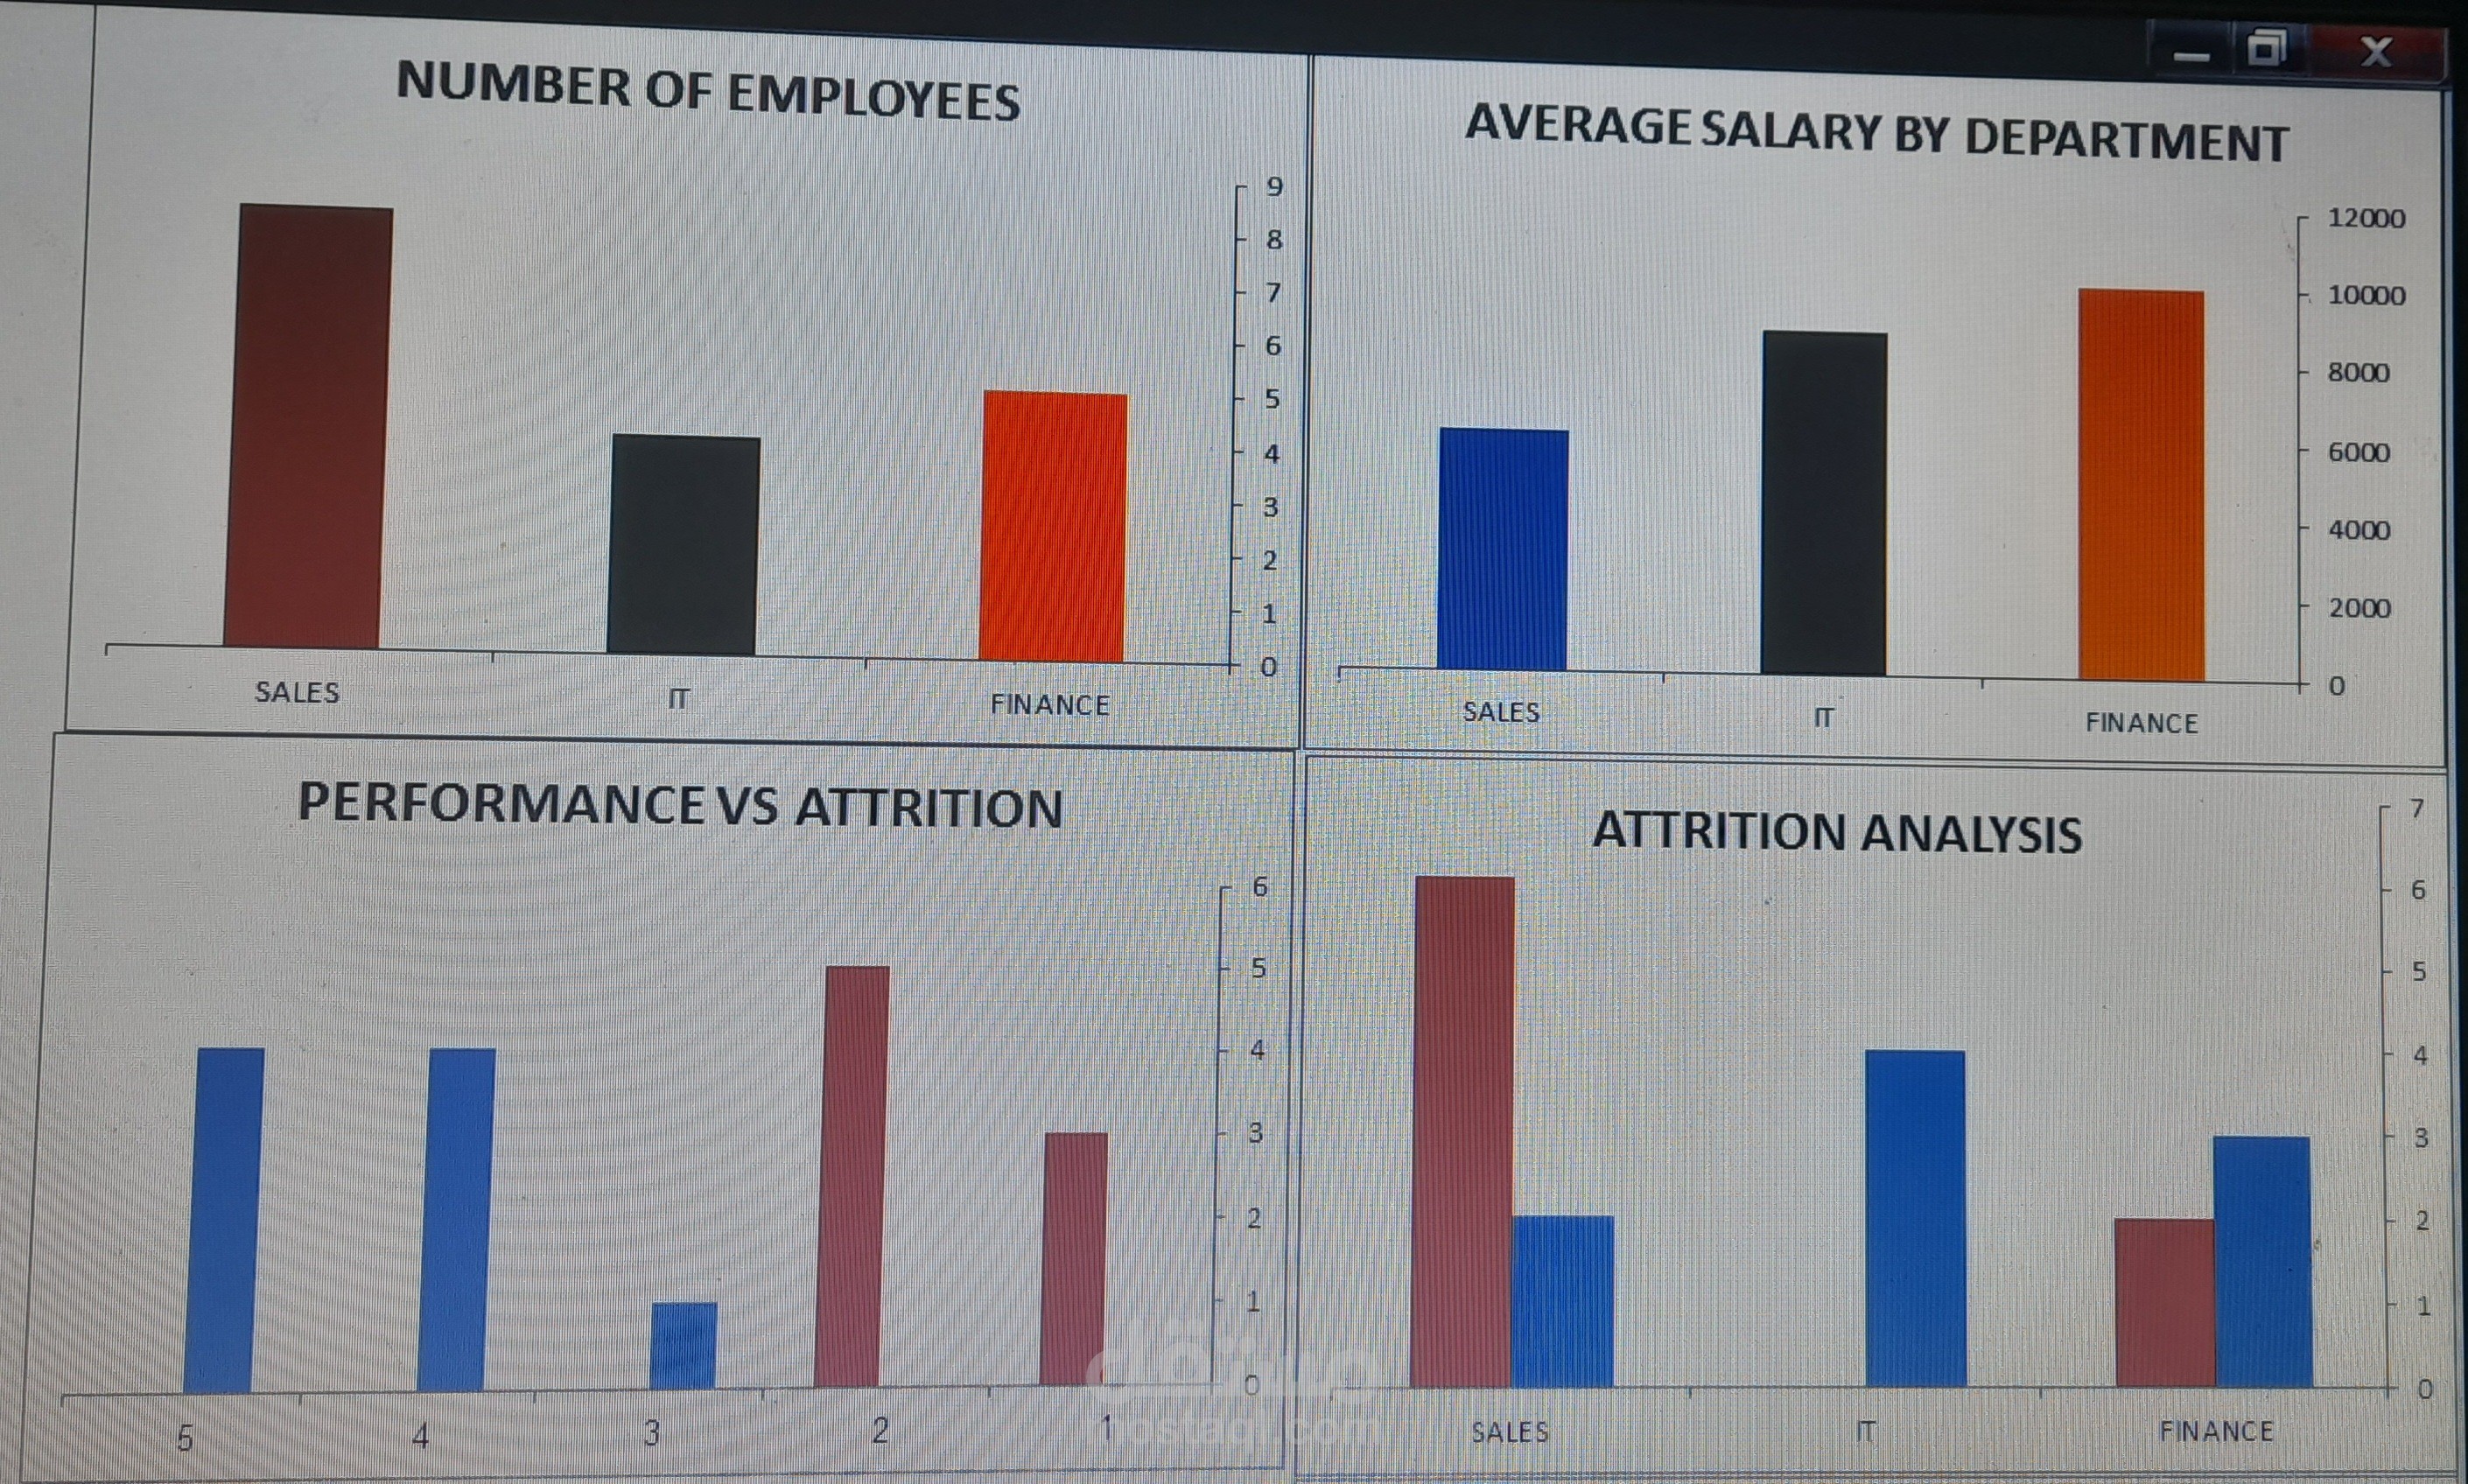
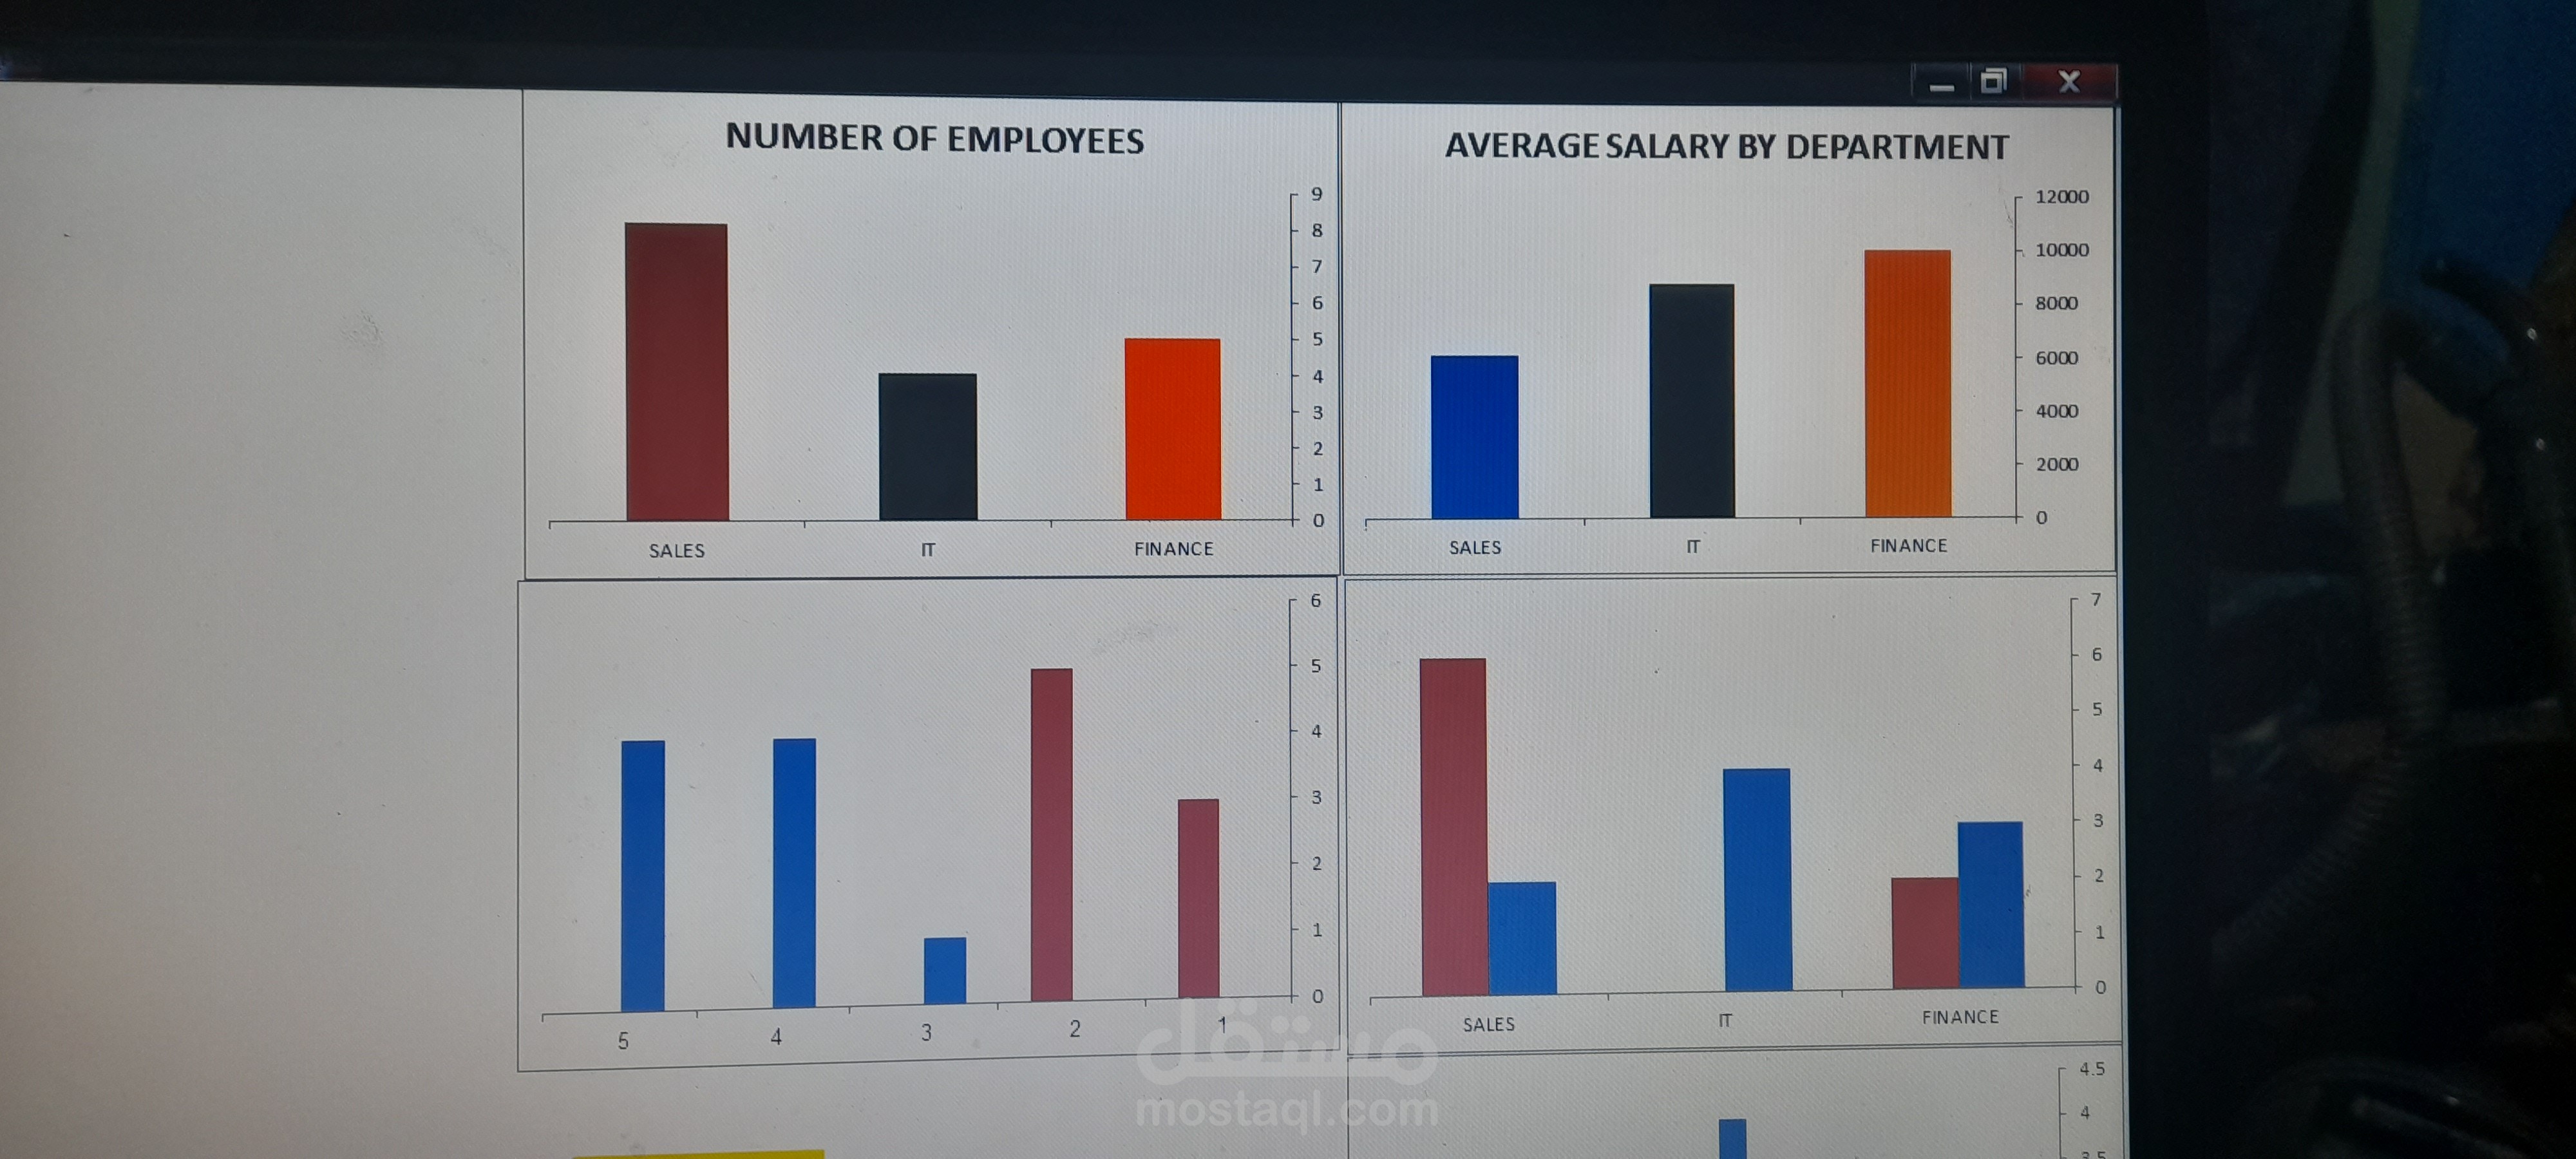
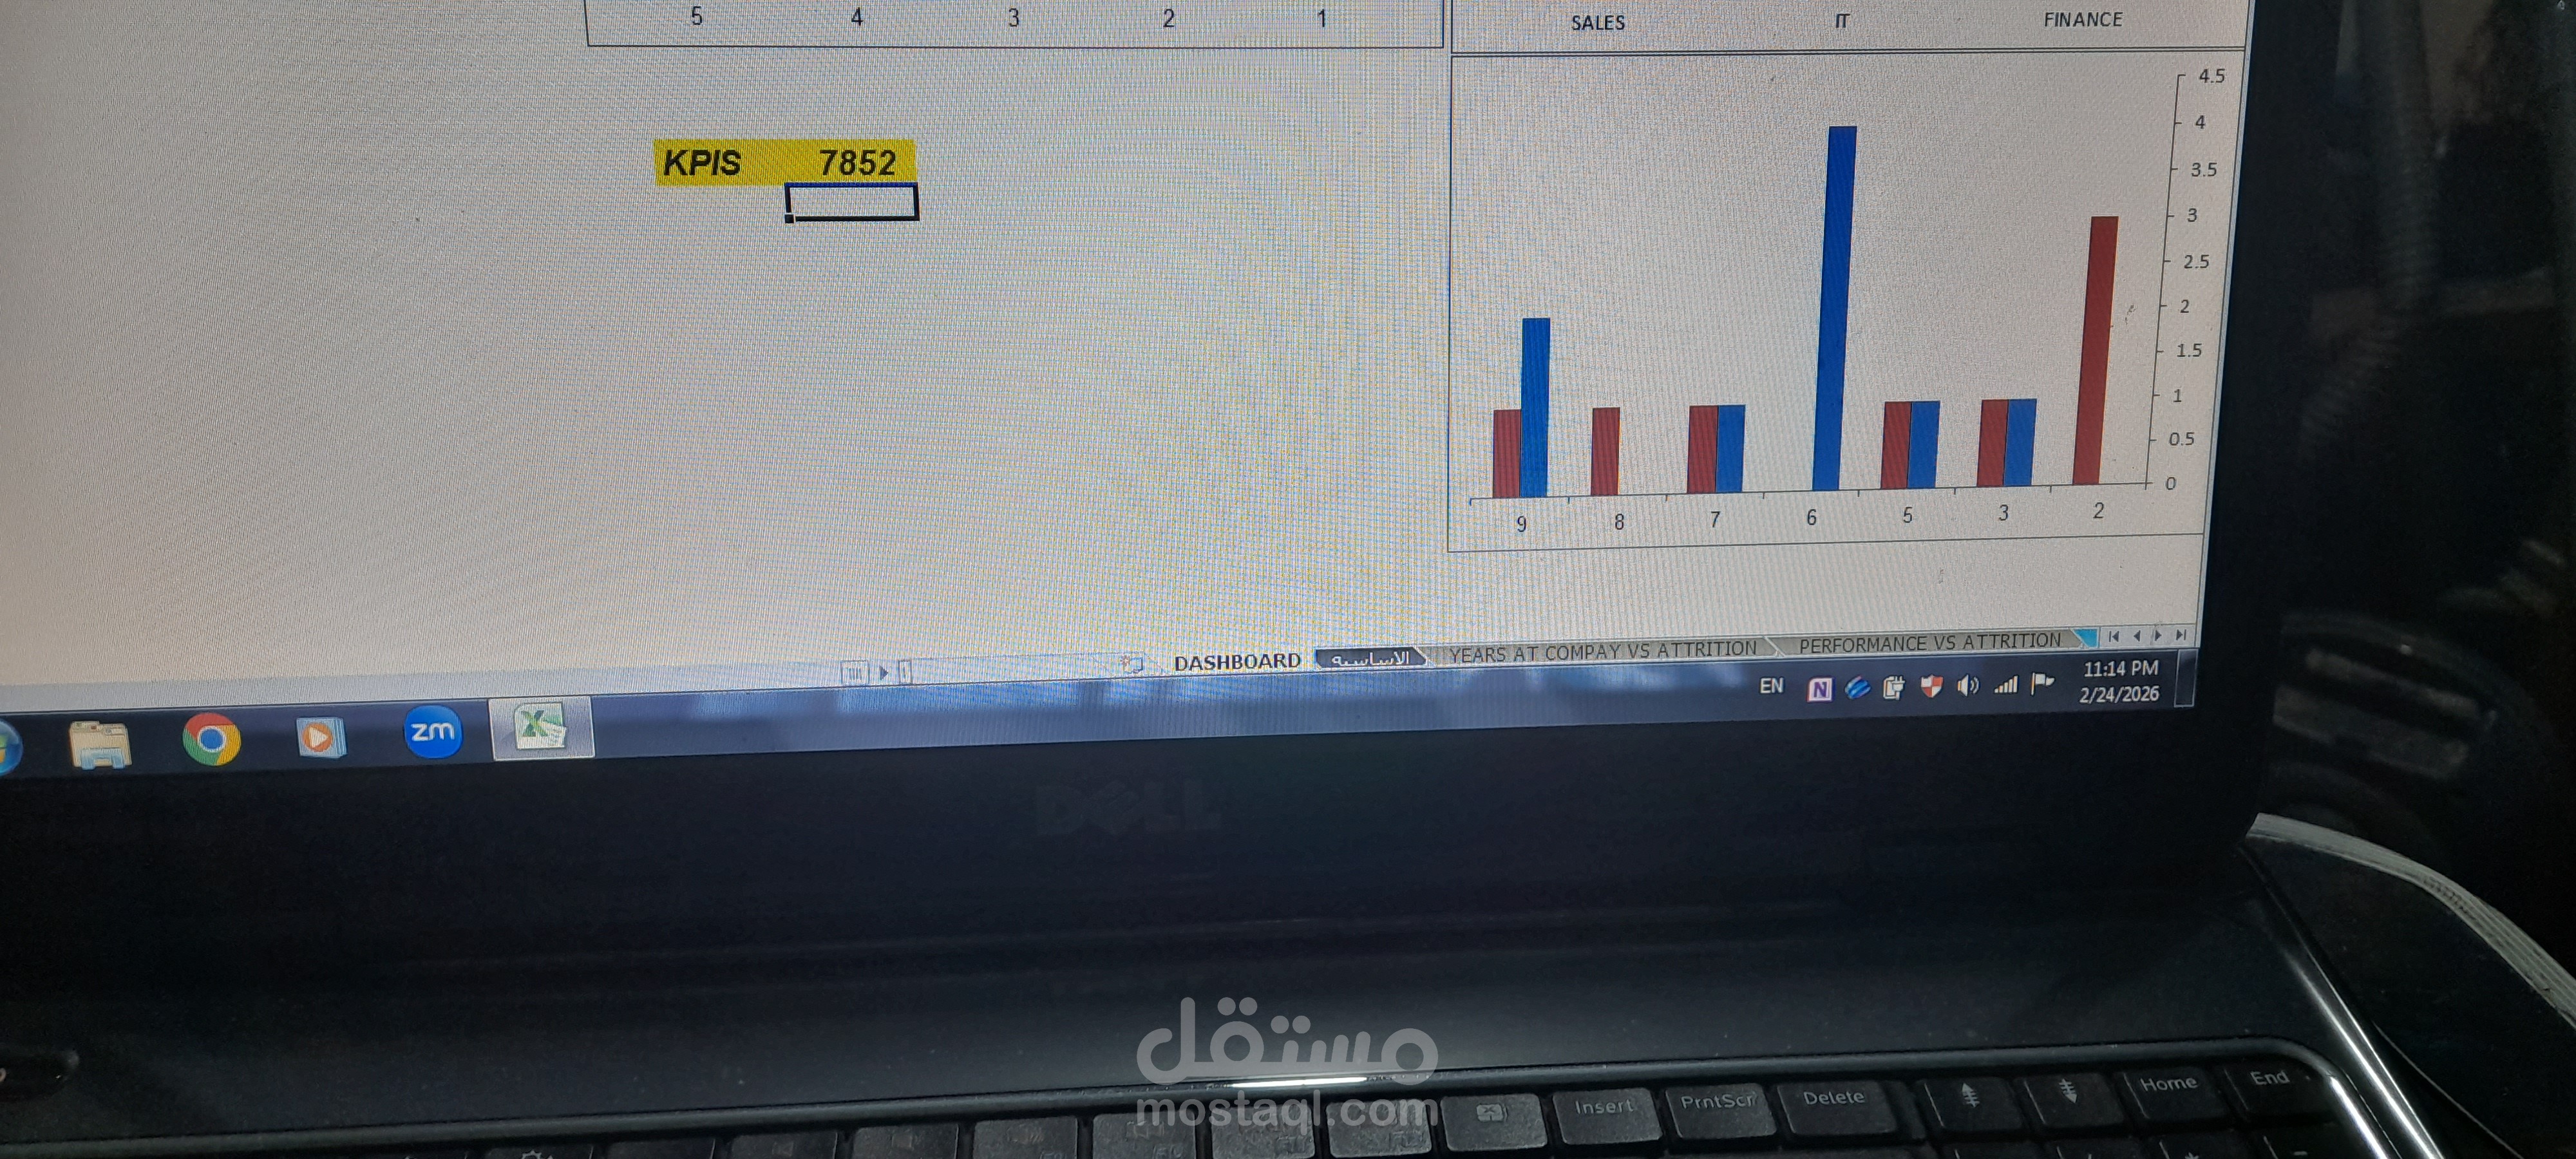
I created a comprehensive HR Analytics dashboard in Excel to visualize key metrics across departments.
This project includes:
1_Number of Employees by Department – highlights headcount distribution across Sales, IT, and Finance.
2_Average Salary by Department – compares salary trends, showing Finance and IT with higher averages.
3_Top Salary Analysis – identifies highest earners per department.
Attrition & Performance Insights – tracks employee turnover and performance levels.
4_Key KPI – overall average salary across all employees.
This dashboard demonstrates my ability to organize, analyze, and visualize HR data effectively, helping businesses make informed decisions.